Skip to content
  • ZipCode Api
  • Blog
  • About RedLine13
RedLine13
RedLine13
Primary Navigation Menu
Menu
  • Start Testing
  • Demo
  • Pricing
  • JMeter
  • Partners
  • Docs
    • Documentation Home
    • AWS Set Up for load testing
    • AWS Approval for Large Tests
    • PHP, NodeJS, Python Load Tests
    • Scalability
    • Jenkins Plugin Setup
    • Premium Features
    • Knowledge Base

reporting

The JMeter Synthesis Report

The JMeter Synthesis Report

2025-04-02

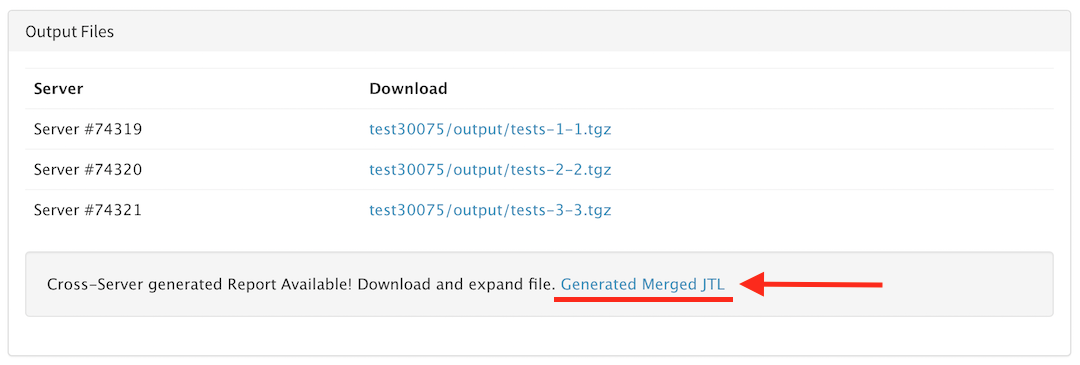
Ordinarily when a JMeter load test is run, request metrics are captured and stored in a JTL file. This format is CSV-compatible, which lends well to using spreadsheet applications or other data analysis tools to perform customized post-test analyses. In cases requiring specific advanced analysis, the Synthesis Report plugin can be leveraged to filter raw responses within the JTL file. Configuring the Synthesis Report Plugin As discussed in another recent post, the JMeter Plugins Manager canRead More →

Merge JTL Output Files for Reports and Offline Analysis

2021-04-22

RedLine13 supports the ability to merge JTL output files for offline analysis after running a load test.  This alleviates the need to download and view each individual JTL output file.  Premium users can merge them into one JTL for convenience.  The ability to merge JTL files provides you with a more streamlined breakdown of your tests.  With this, you can easily cross-examine the individual JTL files that make up the single, merged file. Data analysis SinceRead More →

redline13-cloud-load-testing-free-print-view

Generate Physical Reports for Load Tests with Print View

2017-01-13

We have added the ability for users to preview and print (or save as PDF) the results of their load tests, making it even easier to generate physical reports. Once a load test has completed running, view the results and then hit “Print View” in the summary: From there, you will then be redirected to the print view of the test, where you can control specifically what gets displayed/printed by selecting the appropriate check boxes: ControlRead More →

graph-update-users-running

Update: View Running Users

2016-10-28

We have updated the Overview Graphs by adding the ability to see the exact number of virtual users currently running at that time period. To support this change, we modified simple and custom languages tests to report when a user starts after the ramp up period: Now with our update, graphs will now give more accurate views of when a virtual user starts the test script:Read More →

Generating JMeter Dashboard Report

2016-09-14

We have added support for generating JMeter Report Dashboard across multiple servers and downloading complete report.  This was a new feature contributed to Apache JMeter 3.0 by the UBIK team.  We have integrated this into the RedLine13 service to make running load tests that much easier. Feature requires enterprise plan. Generating Reports Follow the standard steps for running a gatling load test Check “Save the response output from individual tests and calculate percentiles” Select # servers and your cloudRead More →

Recent Posts

  • JMeter XML Format Post Processor
  • Order of Elements in JMeter
  • The JMeter Synthesis Report
  • Using the JMeter Plugins Manager
  • JMeter Rotating JTL Listener

Related

    © RedLine13, LLC | Privacy Policy | Contract
    Contact Us: info@redline13.com

    Designed using Responsive Brix. Powered by WordPress.