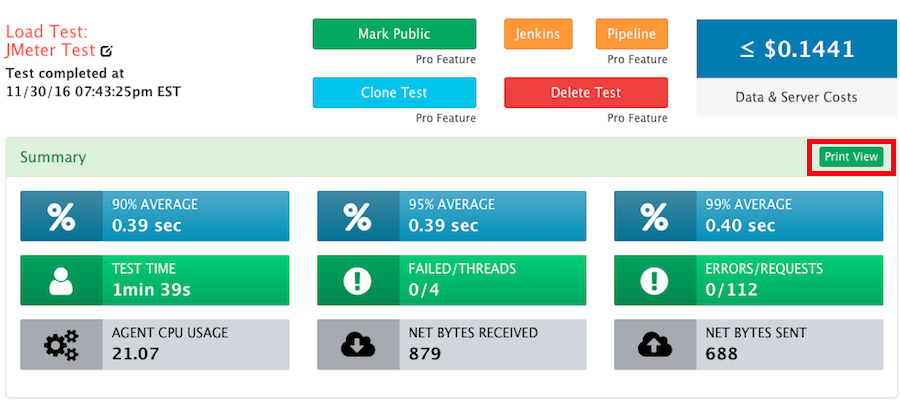
We have added the ability for users to preview and print (or save as PDF) the results of their load tests, making it even easier to generate physical reports. Once a load test has completed running, view the results and then hit “Print View” in the summary:
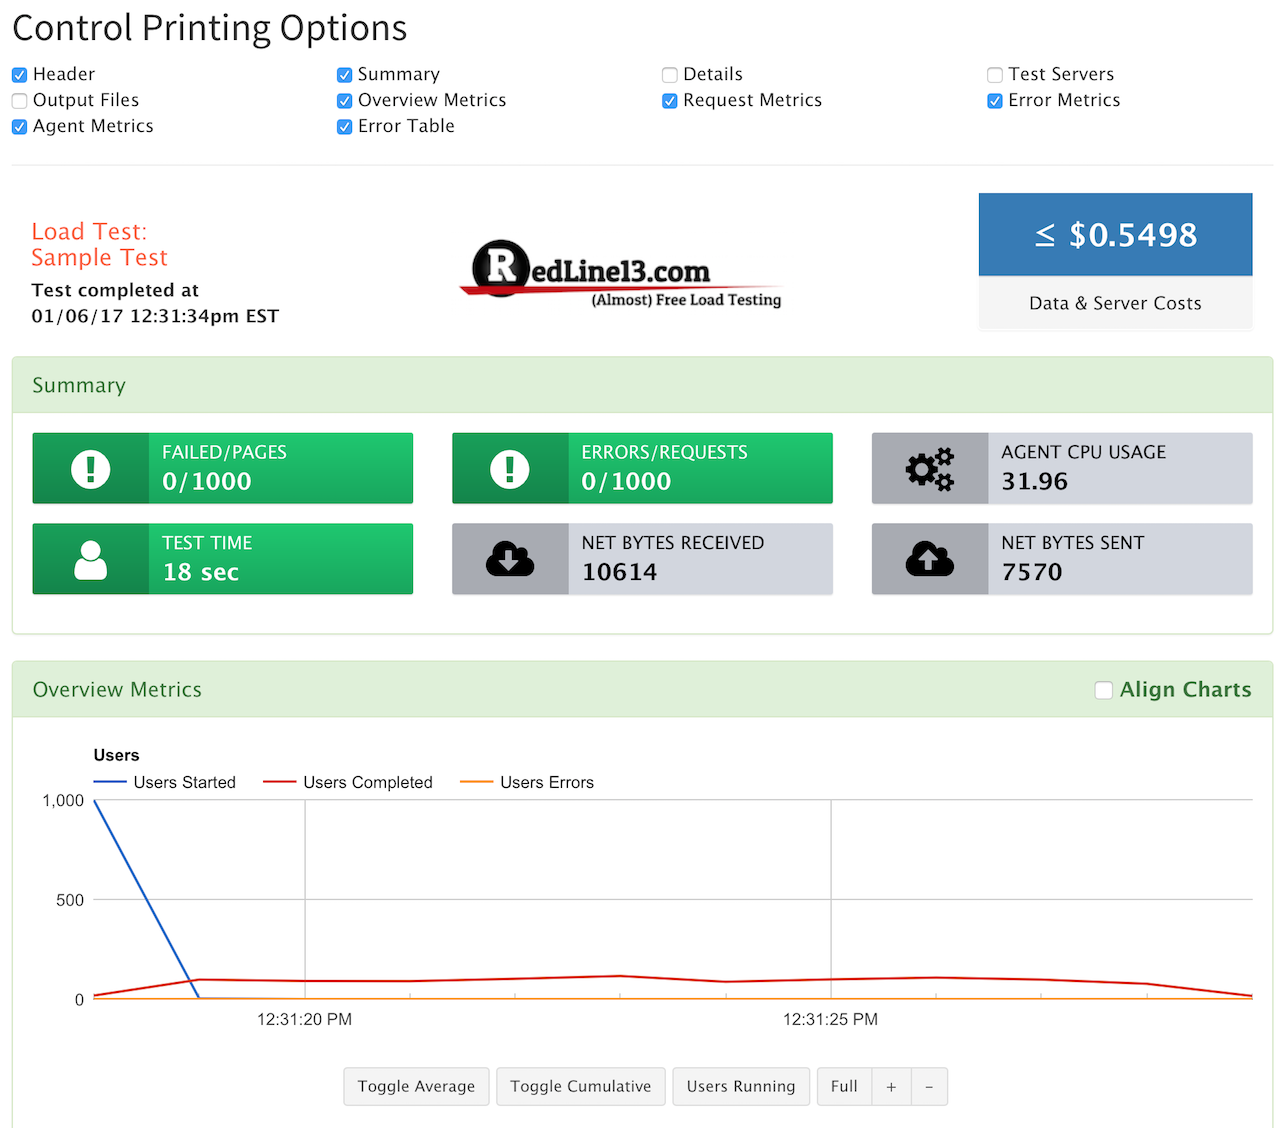
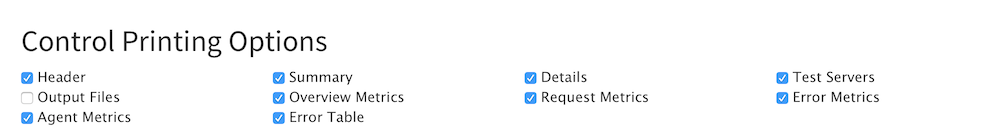
From there, you will then be redirected to the print view of the test, where you can control specifically what gets displayed/printed by selecting the appropriate check boxes:
| Control | Summary |
| Header | Contains name of load test, time/date completed, RedLine13 branding, and data/server costs |
| Summary | Brief overview of load tests |
| Details | Contains test ID, type of test, start/completed time, list of users, ramp up time, delay, load resources, size/type/location/number of servers, number of users, etc. |
| Test Servers | Contains server IDs, server IP addresses, size + price, number of pages |
| Output Files | Display’s response output and percentile results if selected before test |
| Overview Metrics | Graphs detailing users, user response time, average response time, users completed, user errors, etc. |
| Request Metrics | Graphs detailing new page requests per second, average page response time, KB per request |
| Error Metrics | Graphically illustrates errors per second, average error response time, KB per error |
| Agent Metrics | Graphs displaying load agent CPU usage, network bytes received/transmitted |
| Error Table | Lists all errors recorded including error type, error message, server(s) where errors where recorded, and the number of times each error was observed |
You can toggle each control that you need to display exactly the information you want; a useful tool to fine tune your reporting: