Skip to content
  • ZipCode Api
  • Blog
  • About RedLine13
RedLine13
RedLine13
Primary Navigation Menu
Menu
  • Start Testing
  • Demo
  • Pricing
  • JMeter
  • Partners
  • Docs
    • Documentation Home
    • AWS Set Up for load testing
    • AWS Approval for Large Tests
    • PHP, NodeJS, Python Load Tests
    • Scalability
    • Jenkins Plugin Setup
    • Premium Features
    • Knowledge Base

JMeter Dashboard

How to Regenerate JMeter Dashboard Report

How to Regenerate the JMeter Dashboard Report

2024-08-20

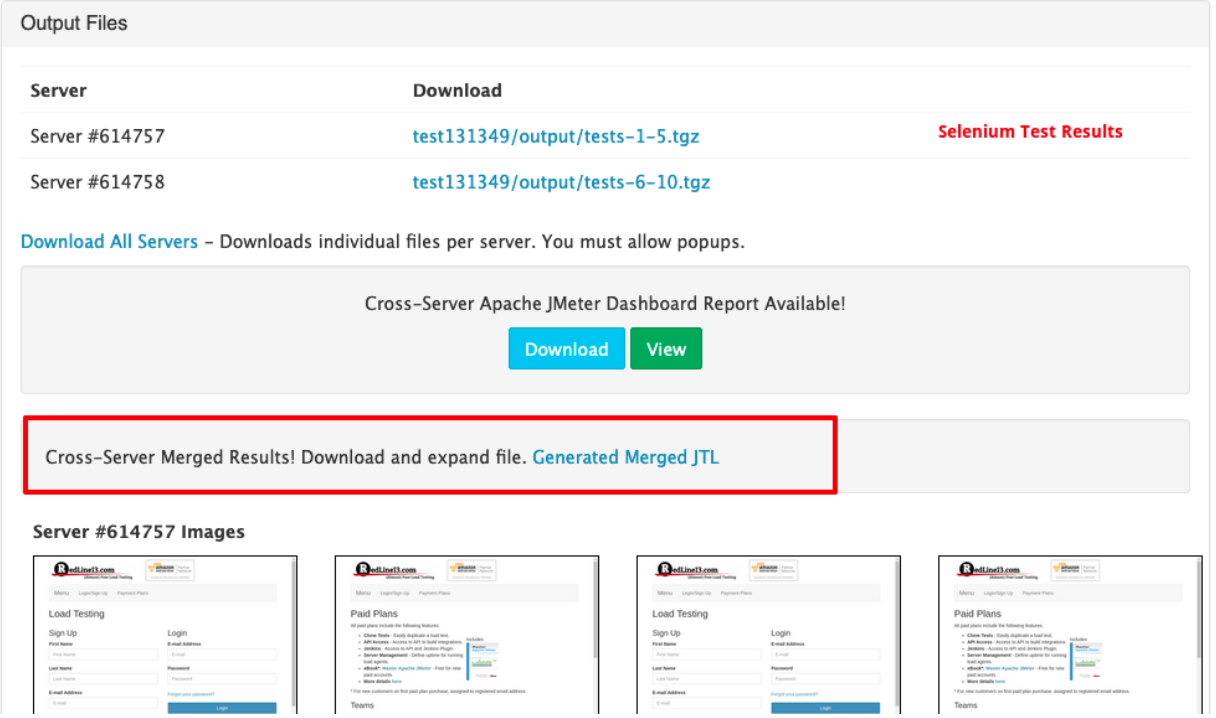
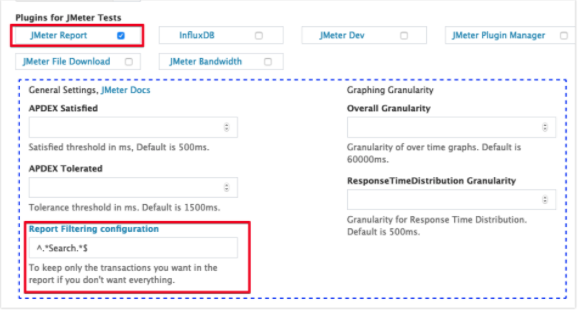
The JMeter Dashboard Report is an HTML-based summary that can be generated from the results data of a JMeter test. When you run your load test with output files enabled on RedLine13, we automatically generate this report. However, this report can also be generated manually on your local machine using the JMeter GUI. Generating the Report Locally To generate the JMeter Dashboard Report on your local machine, begin by starting the JMeter GUI. Navigate to theRead More →

All the Ways to Compare JMeter Load Tests

All the Ways to Compare JMeter Load Tests

2023-09-11

In this post, we will review and compare the different approaches available for comparing two or more JMeter load tests. This is a task we are frequently asked, and the answer often depends ultimately on the requirements of your project. Some of these methods may be used to generate one-off comparisons, while others comprise a system of data collection for comparing many tests over extended runs. We will briefly explain the premise for each of theseRead More →

filter the JMeter Dashboard Report

Filtering the JMeter Dashboard Report

2023-05-10

When you run a JMeter load test on RedLine13 with output files enabled, a JMeter Dashboard Report is automatically generated. The results complement the RedLine13 test results page. In certain use cases it may be necessary to filter the data displayed and recreate the report on a subset of that data. In this post, we will cover how the report is generated, and how to filter the JMeter Dashboard Report to display customized results. How isRead More →

Speak the Lingo using Load Testing Terms

Speak the Lingo using Load Testing Terms

2022-11-15

Load testing is a niche skill within the large trade of quality assurance. With any trade, being able to communicate effectively the nuances and concepts used is essential. In this brief post, we will go over several definitions that will allow you to speak the lingo using load testing terms. Below we have divided these into categories for better organization: General load testing terms Load generator server – Each load test is run on one orRead More →

Uses Cases JMeter Dashboard

Use Cases for the JMeter Dashboard Report

2022-05-17

In a previous post we described how to enable and access the JMeter Dashboard Report. It is a useful reporting platform for JMeter tests, providing a sophisticated level of detail alongside powerful summary metrics. In this post we will describe some specific use cases for the JMeter Dashboard Report related to running load tests on RedLine13. Determining Success or Failure of a Test One of the primary goals of load testing is to experimentally derive orRead More →

non-JMeter files

Non-JMeter tests generate JMeter output results

2020-07-14

RedLine13 lets you take the load test results of non-JMeter tests and do anything you would with JMeter results. That means you can use Redline13 to generate a JMeter Dashboard report for a JMeter test and any other test types. RedLine13 does this by generating a .JTL file for all test types, not just JMeter tests. We suggest downloading your merged .JTL file and load it in JMeter. Open JMeter and just add a listener whichRead More →

JMeter Dashboard Reporting Filter

Tip – JMeter Dashboard Reporting Filter

2020-07-06

The JMeter Dashboard Reporting Filter has a neat ability to only show reports for selected metrics in the JMeter Dashboard Report. Read more in Apache JMeter. We have added support for this in the JMeter Report Plugin in Advanced JMeter settings in RedLine13. If you configure the filtering options for the JMeter report then your RedLine13 graphs will have all your normal responses. While the JMeter Dashboard Report available after test completion in the “Output Files”Read More →

apache-jmeter-redline13-load-testing

JMeter Dashboard and Other Cool JMeter Improvements in RedLine13

2019-06-12

Three new ways that life can be a little easier for JMeter Load Testers. We’ll start with the JMeter Dashboard Report. JMeter Dashboard Report You’ve been able to generate the Apache JMeter Dashboard report for a long time yourself or with RedLine13. But you had to download it, then expand, then view.  Now you can View it inline! So you get the RedLine13 generated reports and you also get access to the full JMeter report as well.Read More →

Recent Posts

  • JMeter XML Format Post Processor
  • Order of Elements in JMeter
  • The JMeter Synthesis Report
  • Using the JMeter Plugins Manager
  • JMeter Rotating JTL Listener

Related

    © RedLine13, LLC | Privacy Policy | Contract
    Contact Us: info@redline13.com

    Designed using Responsive Brix. Powered by WordPress.