When you run a JMeter load test on RedLine13 with output files enabled, a JMeter Dashboard Report is automatically generated. The results complement the RedLine13 test results page. In certain use cases it may be necessary to filter the data displayed and recreate the report on a subset of that data. In this post, we will cover how the report is generated, and how to filter the JMeter Dashboard Report to display customized results.

How is the JMeter Dashboard Report Generated?
As your JMeter load test runs, data is collected and stored in a *.JTL result file. Upon completion of your load test in RedLine13, we collect and merge all JTL files from your load generator servers. From that merged JTL file, we then create the JMeter Dashboard Report and present it as an output file for your test. The actual process of creating the report is functionality extended by the JMeter command line.
Filtering Data for the JMeter Dashboard Report
JMeter provides several command line options for filtering on data when generating the Dashboard Report. Those options are listed under general settings on the official documentation page. In the next section we will review how to use these options to regenerate the report.
There is also a second option which is more suitable if the data you are seeking to report on is more complex. The structure of a JTL file is identical to that of a CSV file, and can be readily modified using any spreadsheet application (e.g., Microsoft Excel). All you need to do is rename the file to a *.CSV extension, as shown below:
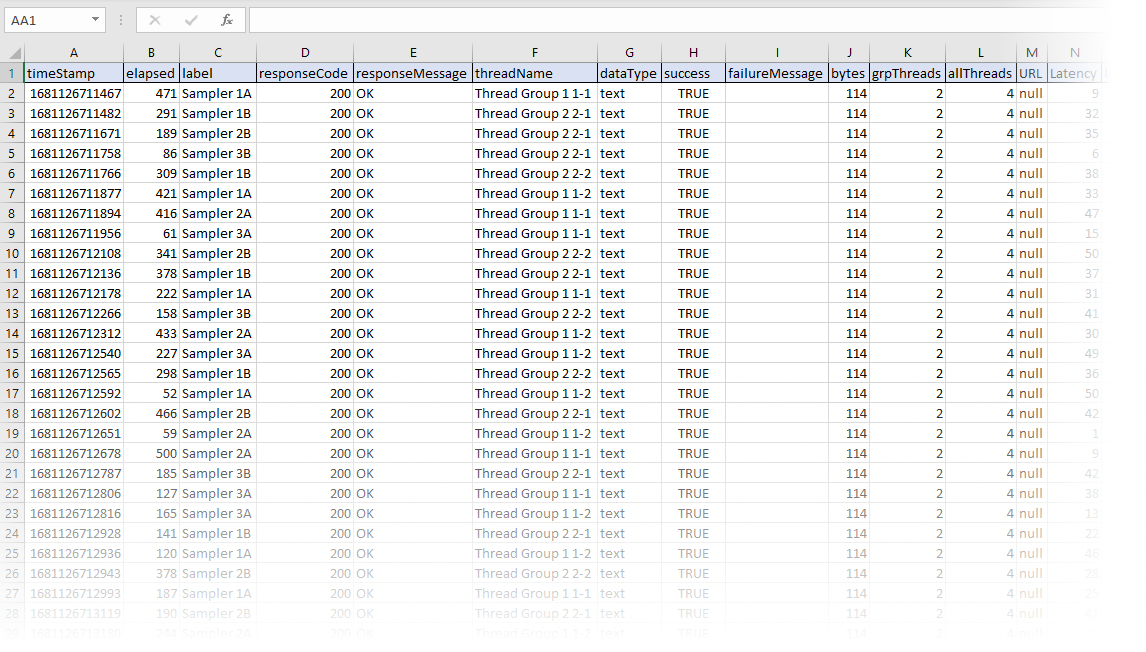
JTL file into Excel for advanced analysis.How to Regenerate the Dashboard Report
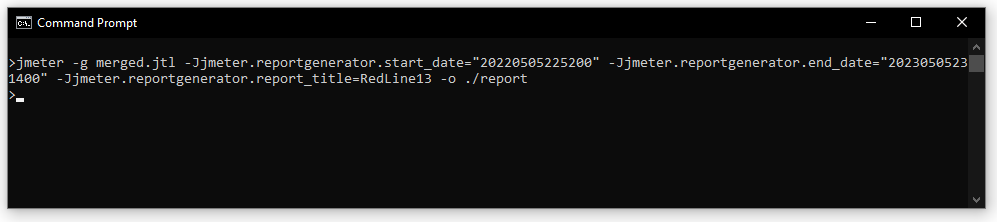
The JMeter Dashboard Report is compiled by the reportgenerator class accessible from the JMeter command line. When running the report generator command you have the opportunity to specify several settings which can constrain your data. One common use case would be to constrain by timestamp, which would allow you to report on a particular segment of your test (e.g., steady-state). The following example shows how you can accomplish this:
jmeter -g merged.jtl -Jjmeter.reportgenerator.start_date="20230505225200" -Jjmeter.reportgenerator.end_date="20230505231400" -Jjmeter.reportgenerator.report_title=RedLine13 -o ./report
Timestamps start_date and end_date are in the Java SimpleDateFormat notation using the format “yyyyMMddHHmmss”. Running the above command with any options you chose will cause JMeter to recompile the Dashboard Report to a folder on your local machine. The last parameter in the above command line example specifies the local folder where the report and supporting files will be generated.
Another useful parameter is the overall_granularity setting, which defines how data is aggregated and displayed on graphs. The default granularity is 60000ms (one minute) such that graphs are displayed with one minute ticks. For very short or very long tests, your graphs can be made more readable by adjusting this number.
Did you know that RedLine13 offers a full-featured free trial? Sign up now and move your JMeter testing into the cloud today!