Anyone who has done load testing knows it’s a lot more than creating a script and running it. There are going to be times when it requires what we call ‘Advanced Load Testing Troubleshooting’.
Here is a real case of a RedLine13 customer who was trying to figure out what was causing an unusual load testing graph result. The issue was the graph Percentiles per Page Response Time graph. But sometimes the problem we see is not the real problem. Let’s not get ahead of ourselves. So let the troubleshooting begin.
The (Perceived) Problem
For all the tests the company was running, they saw the behavior that at the end of the test at exactly the last 1 minute with a sudden spike in the graph.

Their understanding of the above graph behavior is that, since they stop the test suddenly at the end of the test, there may be some requests being sent but did not receive the response due to that spike is happening. Their questions:
- Would this sudden spike cause any effect on the overall tests response times (they consider 90 Percentile values)?
- Is there a way they could get response times table values by eliminating the last 5 minutes?
Our initial response was that they could do this manually:
- Download the merged .JTL results
- Strip out last 5 minutes
- Reimport into JMeter directly
But we investigated a little more. We saw how their reference test had a spike in the response at the very end of their test. We saw it in the JMeter JTL file and our results.
Despite the fact that the customer said they “stop the test suddenly at the end of the test” it is odd that this would cause the result time at the end to spike, since JMeter JTL is written at each response. If the test ends abruptly we would expect the actual result not to be written.
So we dug into their JTL focusing on just one endpoint for no particular reason except it helps dig deeper.
From the graph we show (and the standard JMeter generated graphs) you would think it is end of test.

But when we hit toggle average and looked at the sum line, something looked odd.

Their total time/throughput is higher on rampup and rampdown. So, using their JTL we stripped out just the results for this endpoint and generated a graph – but instead of 1 minute aggregation we used 10ms.
Load Testing Troubleshooting Diagnosis
With the graph below we could see they had micro-performance issues through out the test. Since their test is large enough, they get averaged out at per minute and even per 10s.
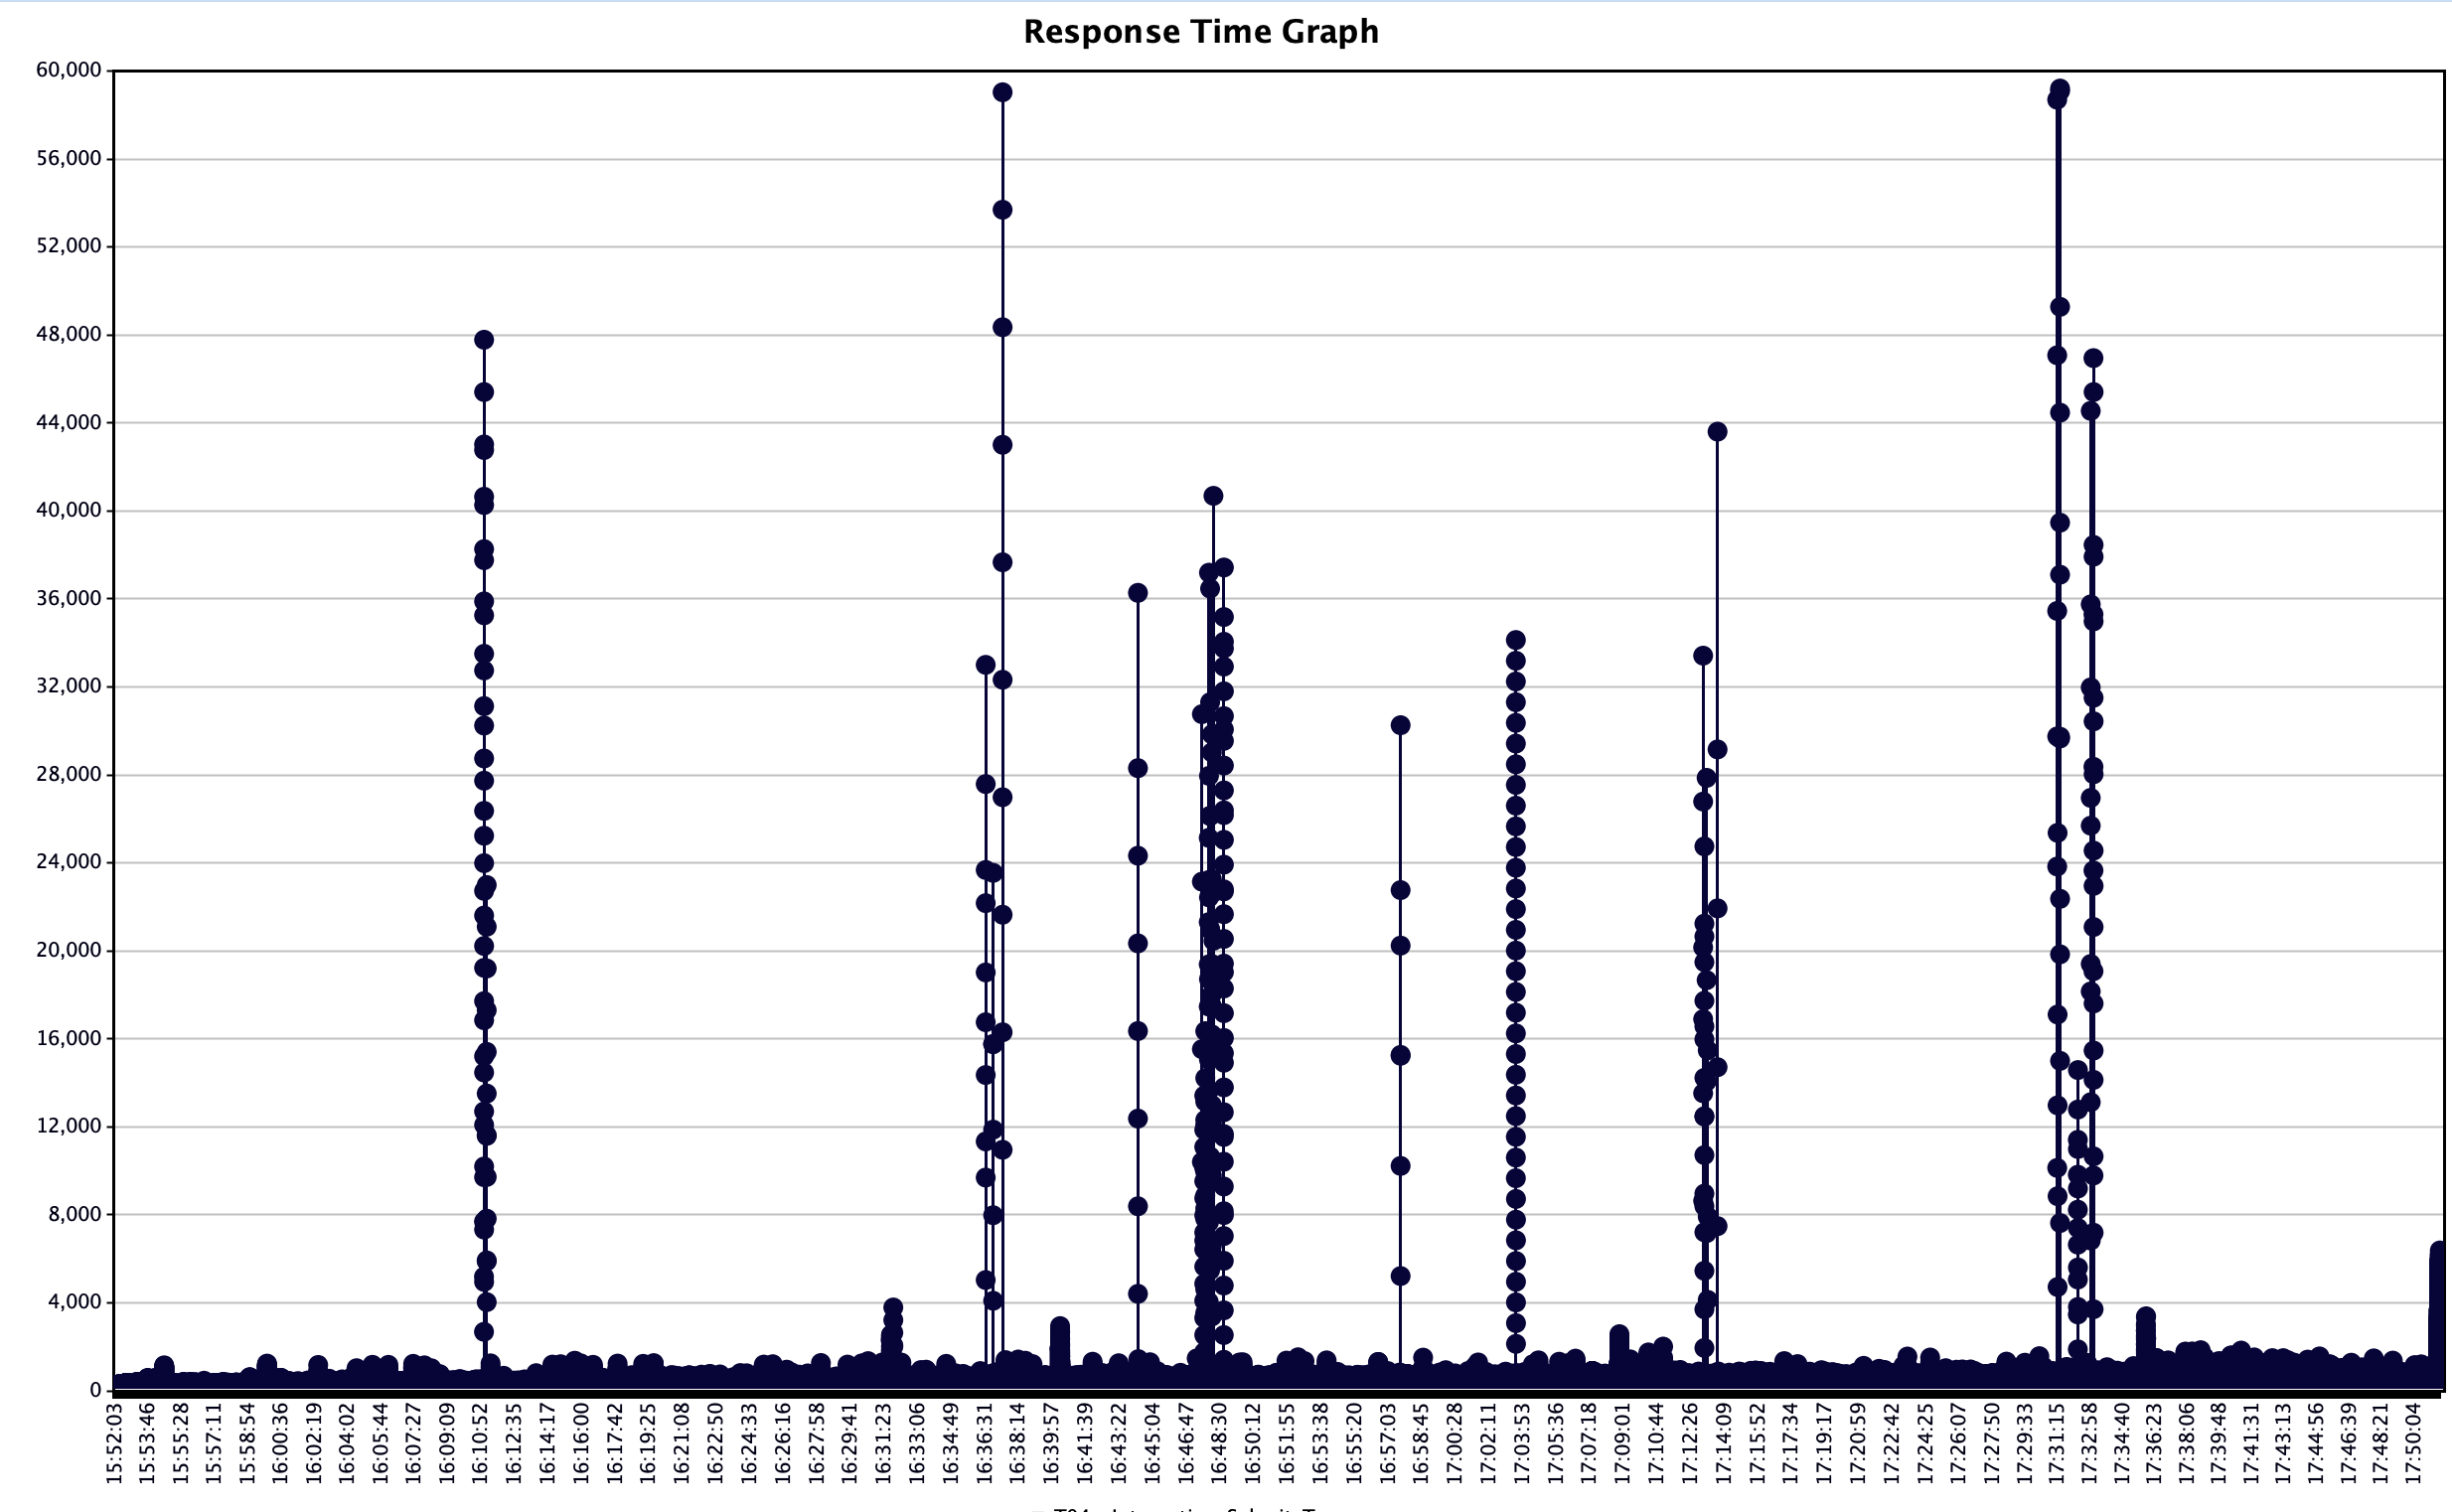
Our conclusion was that their 99% percentile is accurate and it is not a last minute issue. But these tiny issues during the test were the problem. With this information, the customer was able to identify where their real problems were. It was not a last minute issue.
Another case of advanced load testing troubleshooting solved.
This difficulty in being able to see the problem was caused by the granularity of the report. Here’s another post that talks about Advanced Load Testing – Granularity.
You can try your own test, whether it is simple or advanced, on RedLine13 for free.