Apache JMeter is one of the most popular tools for load testing. With RedLine13, scaling out your JMeter test plan on the cloud in is easy. In this video and subsequent guide, we will walk you through running you first JMeter load test on RedLine13.
Getting Started
When running a JMeter test on RedLine13, we begin by logging into our account, hitting “Start Test“, and then navigating to the “JMeter” tab.
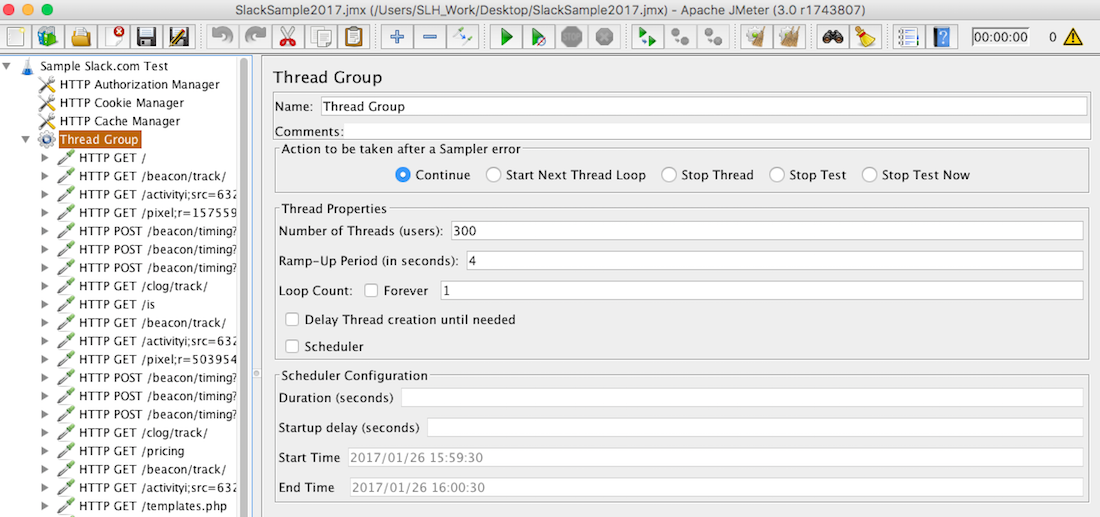
Obviously we will need a JMeter test prepared beforehand. In this example, I have created a simple JMeter test for Slack.com. I made the test to have the users click around and navigate their site (for that I used our Selenium to JMeter Firefox plugin). In this test, we simulated 300 users (threads) to hit the site, making a bunch of requests. The test will take 4 seconds to ramp up and then run only once:
Upload Your Test Plan & Configure Test
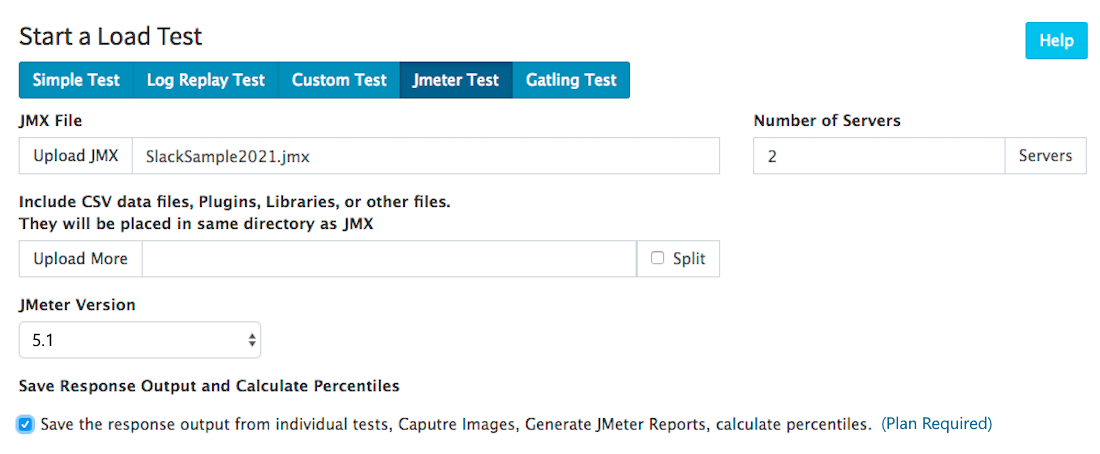
Then you simply upload your created JMeter test plan to RedLine13, select the number of servers and the JMeter version. We also checked the box next to the “Save Response Output and Calculate Percentiles” to access more metrics and download reports (requires a Basic or Premium subscription). Additionally, you can attach any other files as needed:
Next we will configure our “Advanced Cloud Options“. Here you can control the EC2 profile of your load agents. You can select the type, size, number, and location of the servers, as well as select subnets, edit security groups, and more. In this example we will illustrate the capability of a load test to span across multiple AWS regions. Here we are spinning up one m3.medium server in US-East-1 (N. Virginia) and another m3.medium in the US-West-1 (California) region:
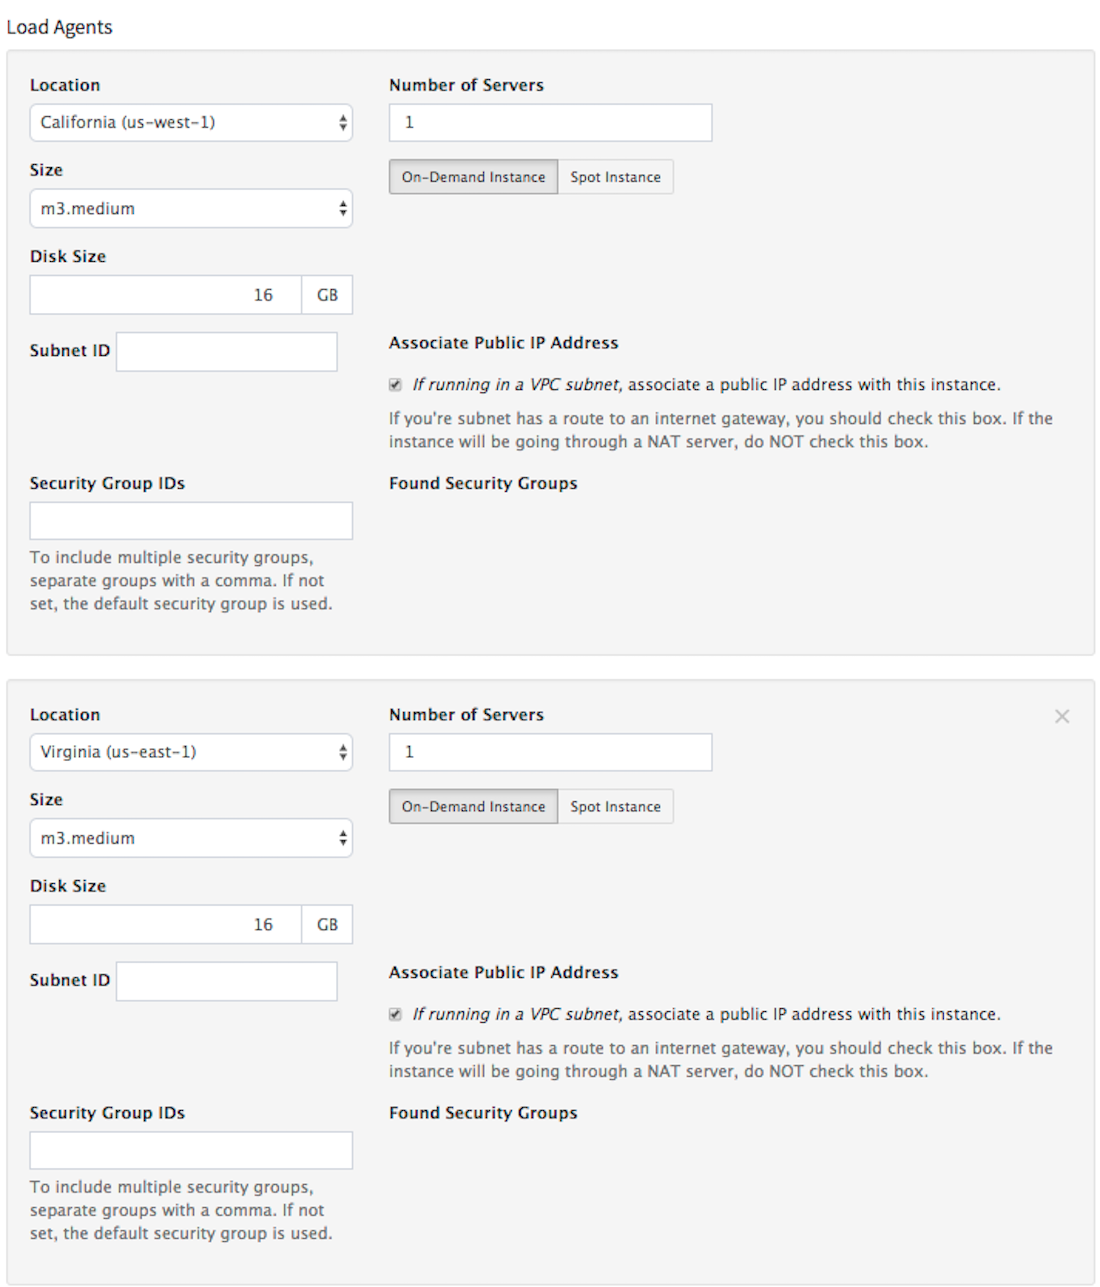
Advanced cloud options such as Create EC2 IAM Instance Profile and Attaching AWS Instance Profile to a load agent are available via plugins on RedLine13.
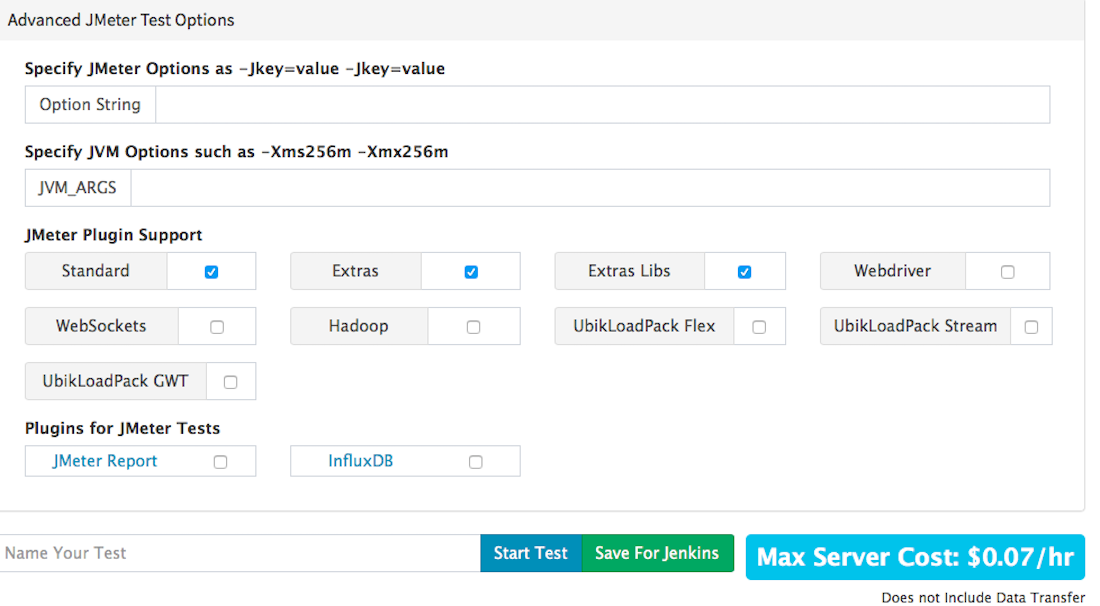
If needed, you can also expand the “Advanced JMeter Options” to use various plugins, create JMeter reports, specify JMeter option strings, etc. For this example we will keep the default settings:
Run Your Test + Analyze Results
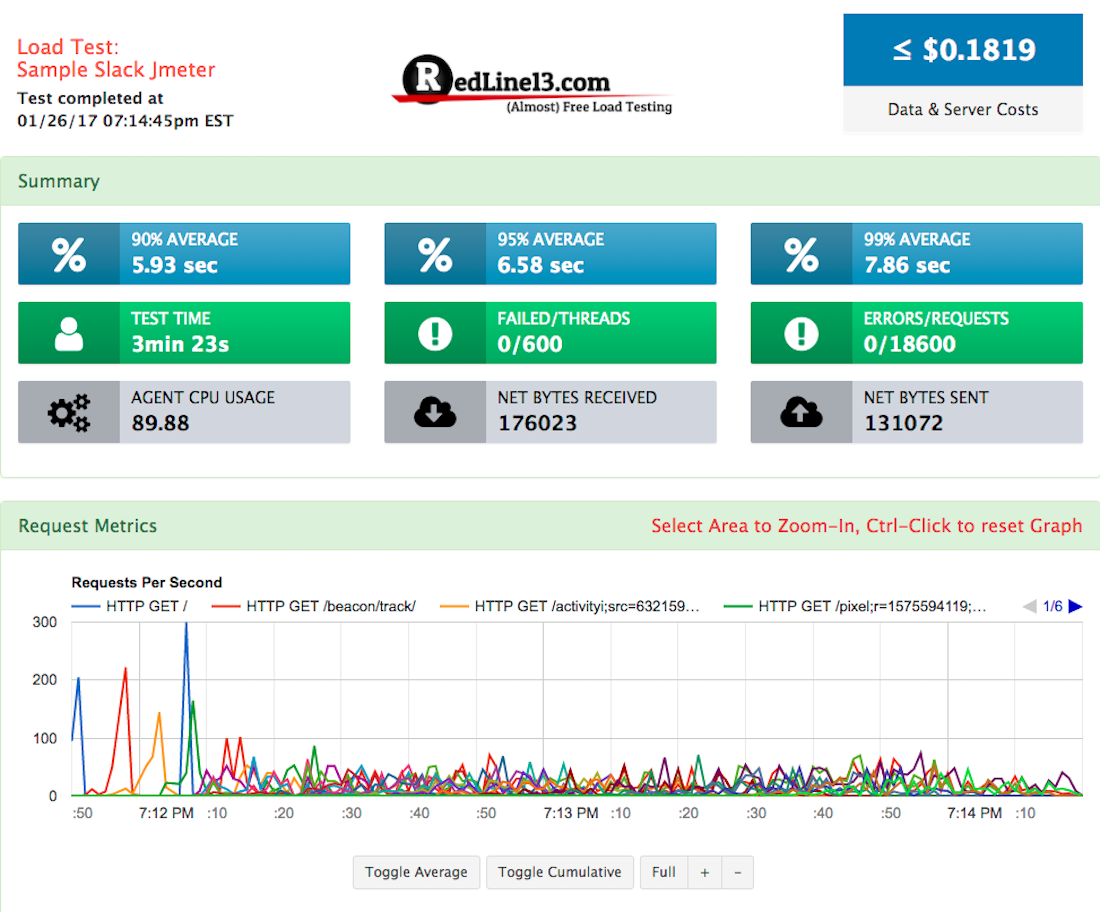
We will now name our test, and then hit “Start Test” to begin. Our servers will spin up and our test will begin shortly. Once our test has completed, we are redirected to the results page. Here we are presented with an overview and breakdown of everything that happened while running your JMeter load test. You will find the following:
- Response/request metrics
- Percentile results (with Basic and Premium subscriptions)
- Overview metrics (threads per second, average thread elapsed time, etc.)
- Error metrics (error response time, errors per second, etc.)
- Load agent metrics (load agent average CPU usage, network bytes received/transmitted, etc.)
- Server output files (as downloadable .tgz archives)
- Cross-server generated JMeter report
- Merged JTL
- + more
All results are displayed on interactive graphs (can export data as a .csv file). In this test, we generated a total of 600 users across two servers. Some 18,600 requests were made, of which 99% completed within 7.86 seconds. As you can see our test costed us only $0.18 cents in total, making RedLine13 a great way to affordably scale out your JMeter tests.
Sign up for a free trial account today and explore more ways you can leverage RedLine13 to empower your JMeter load tests.