We have added support for generating JMeter Report Dashboard across multiple servers and downloading complete report. This was a new feature contributed to Apache JMeter 3.0 by the UBIK team. We have integrated this into the RedLine13 service to make running load tests that much easier.
Feature requires enterprise plan.
Generating Reports
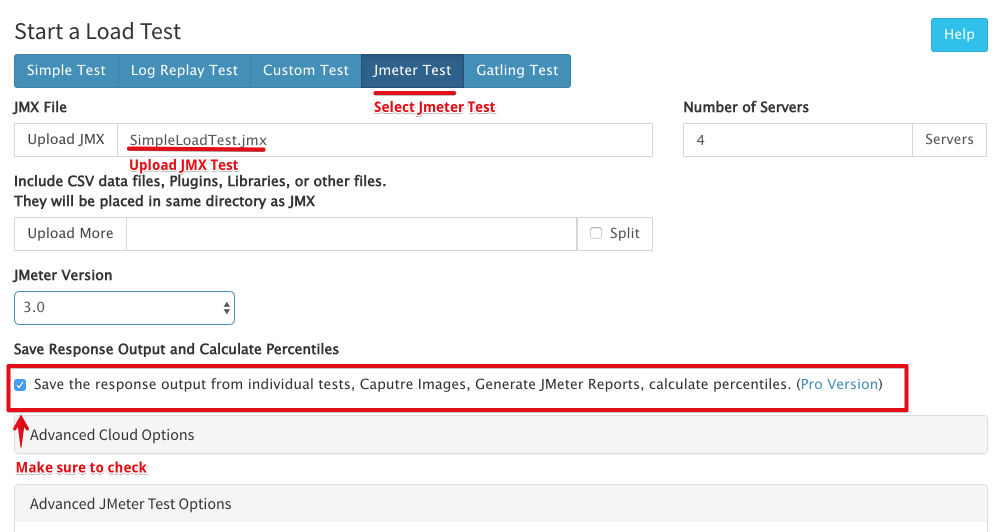
- Follow the standard steps for running a gatling load test
- Check “Save the response output from individual tests and calculate percentiles”
- Select # servers and your cloud settings.
Customizing Report Options
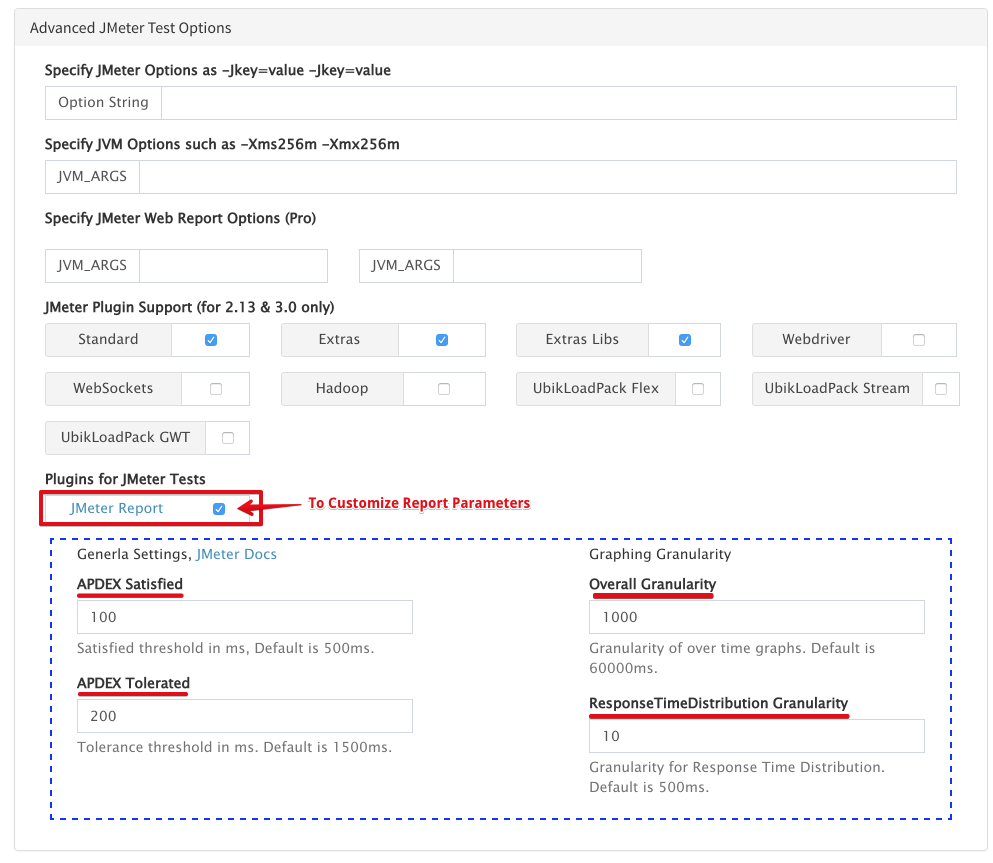
- You can customize the parameters that are passed into the report generator, currently these fields are available
- APDEX Satisfied – ms threshold for APDEX level
- APDEX Tolerated – ms threshold for Tolerated
- Overall Granularity – ms granularity for over time graphs
- ResponseTimeDistribution Granularity – ms granularity for specific Response Time Distribution graph
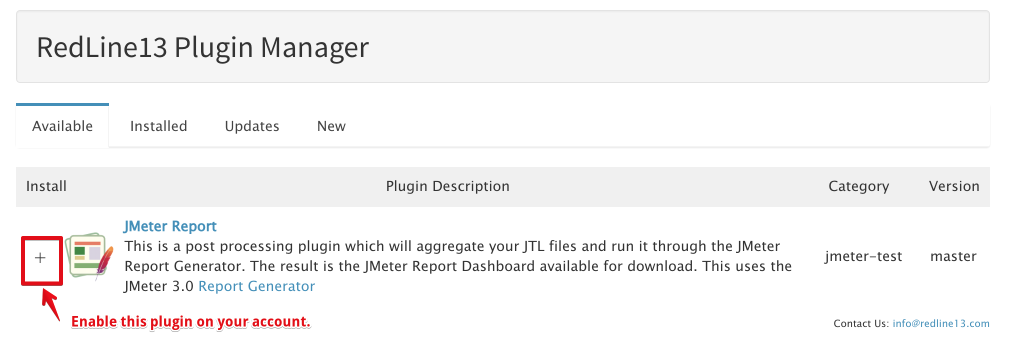
- First Enable the Plugin
- Then during test creation in the Advanced JMeter Test Options you can enable the plugin to customize the report.
Accessing JMeter Dashboard Report
Run the test and once the RedLine summary is available and post test processing completes, continue to Output Files.
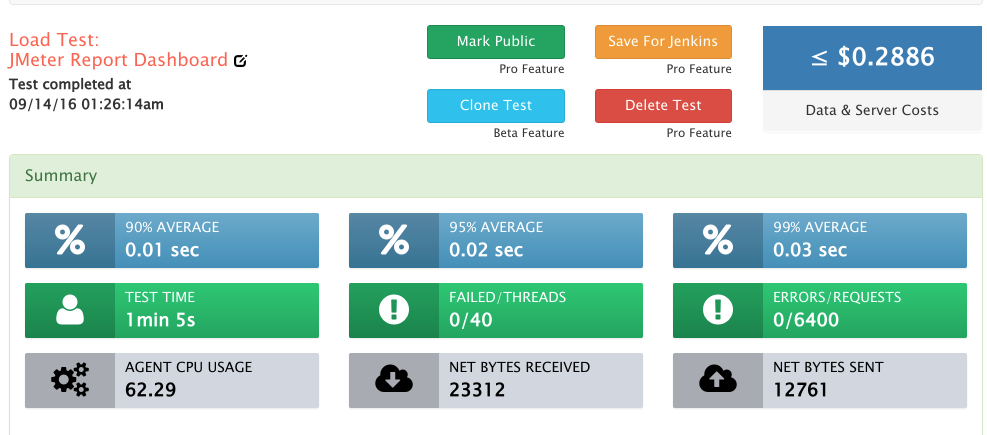
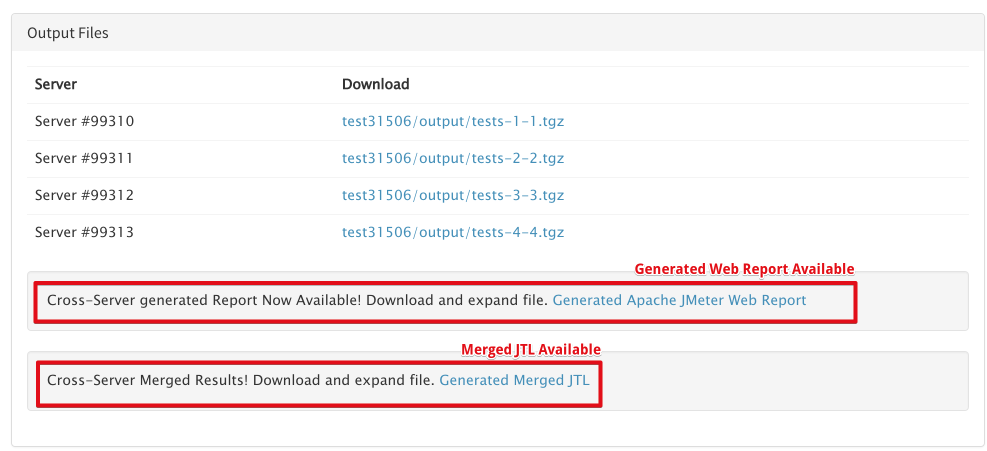
After the test completes and finishes its post-processing the output files will be available. The following report is from the aggregated data across all 4 load agents. You will have access to
- Individual Output by server
- Merged JMeter Dashboard Report
- Merged JTL file for your own processing
Viewing the Report
You can then download and view the Generated Web Report.
- Download
- Expand
- Open index.html
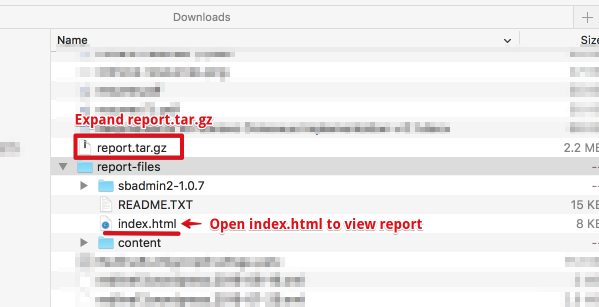
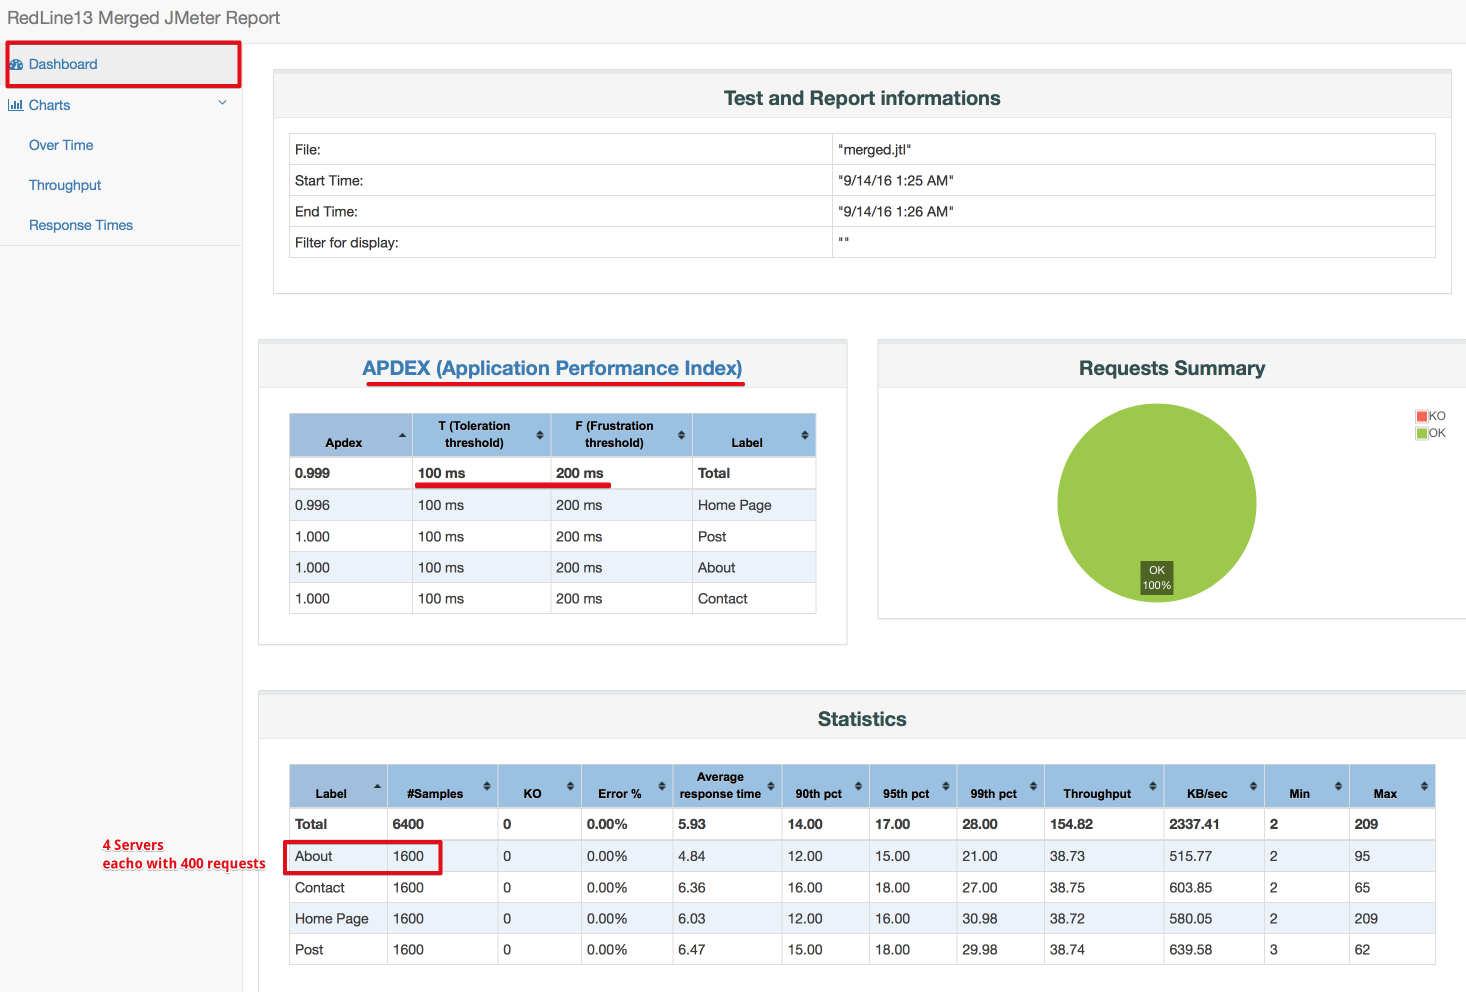
The report will open and give you access to the full dashboard with results merged from all files.
Example Dashboard Page
Example Charts

The example Test is available at here.
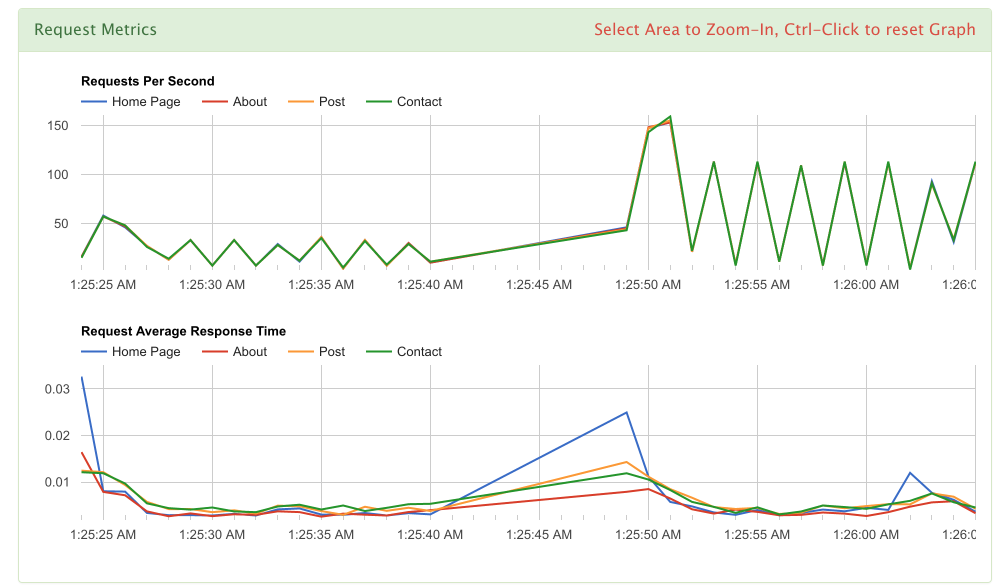
RedLine13 Reports
And with every test the RedLine13 Reports are available as well.