Skip to content
  • ZipCode Api
  • Blog
  • About RedLine13
RedLine13
RedLine13
Primary Navigation Menu
Menu
  • Start Testing
  • Demo
  • Pricing
  • JMeter
  • Partners
  • Docs
    • Documentation Home
    • AWS Set Up for load testing
    • AWS Approval for Large Tests
    • PHP, NodeJS, Python Load Tests
    • Scalability
    • Jenkins Plugin Setup
    • Premium Features
    • Knowledge Base

JMeter Video Stream Tutorial with UBIKLoadPack 

By: RedLine13

Starting Point

We used the provided tutorial and demo as our starting point.

http://www.ubik-ingenierie.com/blog/easy-and-realistic-load-testing-of-http-live-streaming-hls-with-apache-jmeter/

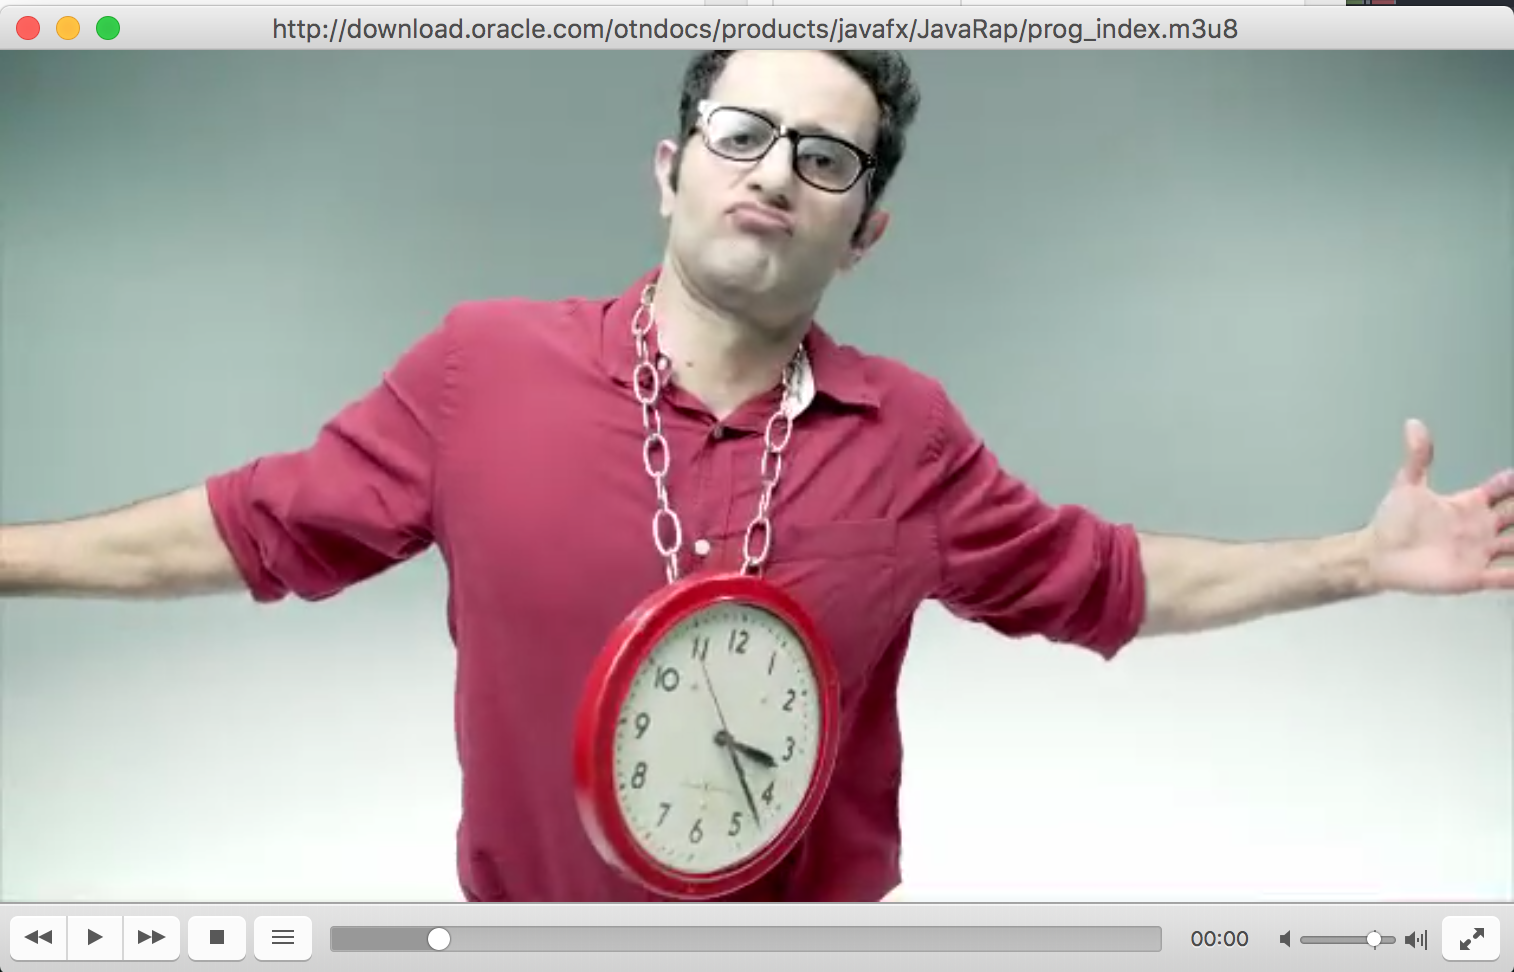
We are playing back this video stream (http://download.oracle.com/otndocs/products/javafx/JavaRap/prog_index.m3u8)  for our Java friends.

Screen Shot 2015-11-15 at 10.38.11 AM

Highlights of UBIKLoadPack HTTP Live Stream

Simplified Testing
  • provide link to stream
  • quick see the playlist
  • control bandwidth
  • Play all or selection
Screen Shot 2015-11-15 at 10.42.19 AM
More than standard metrics
  • Buffer fill time
  • Lag Time
  • Play time
  • Lag Ratio
  • Download Time
Screen Shot 2015-11-15 at 11.44.02 AM
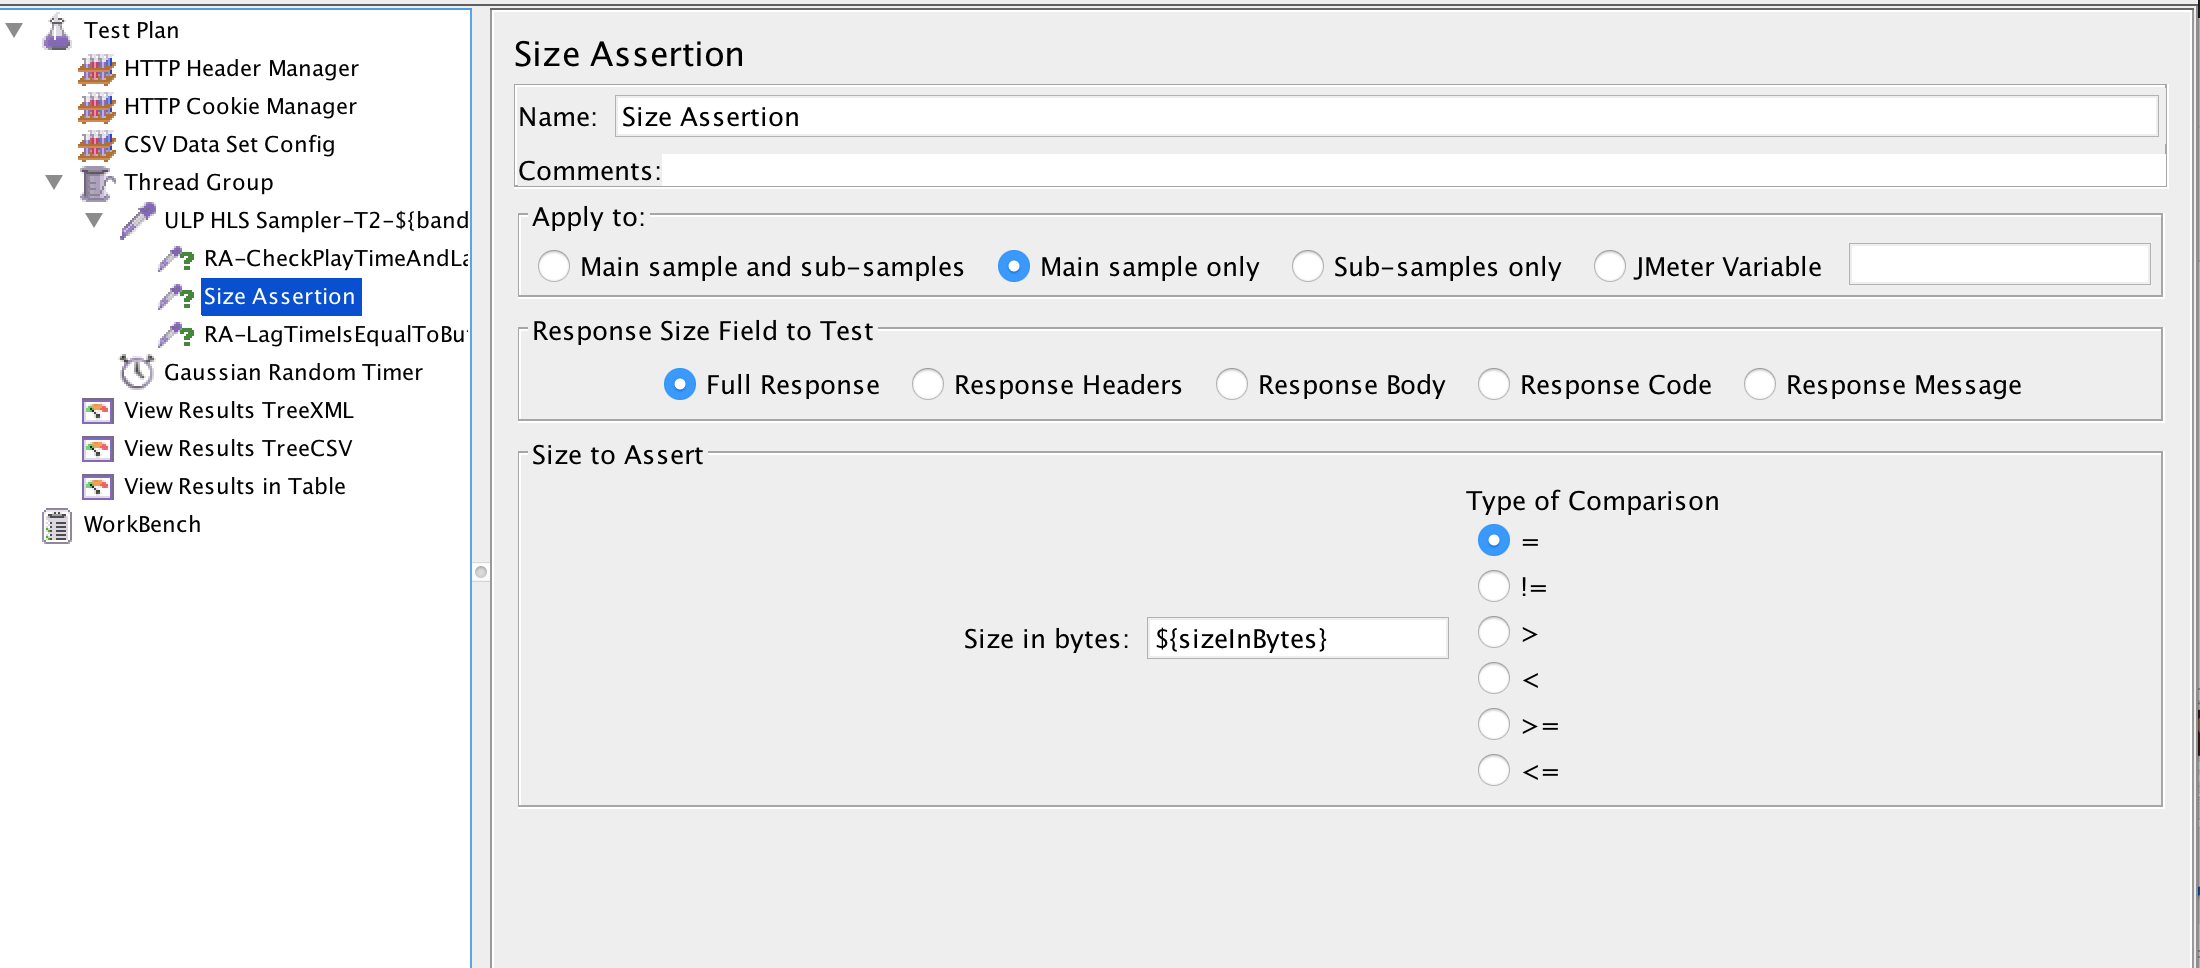
Use standard assertions
  • can be applied to custom metrics
  • ensure full video downloads


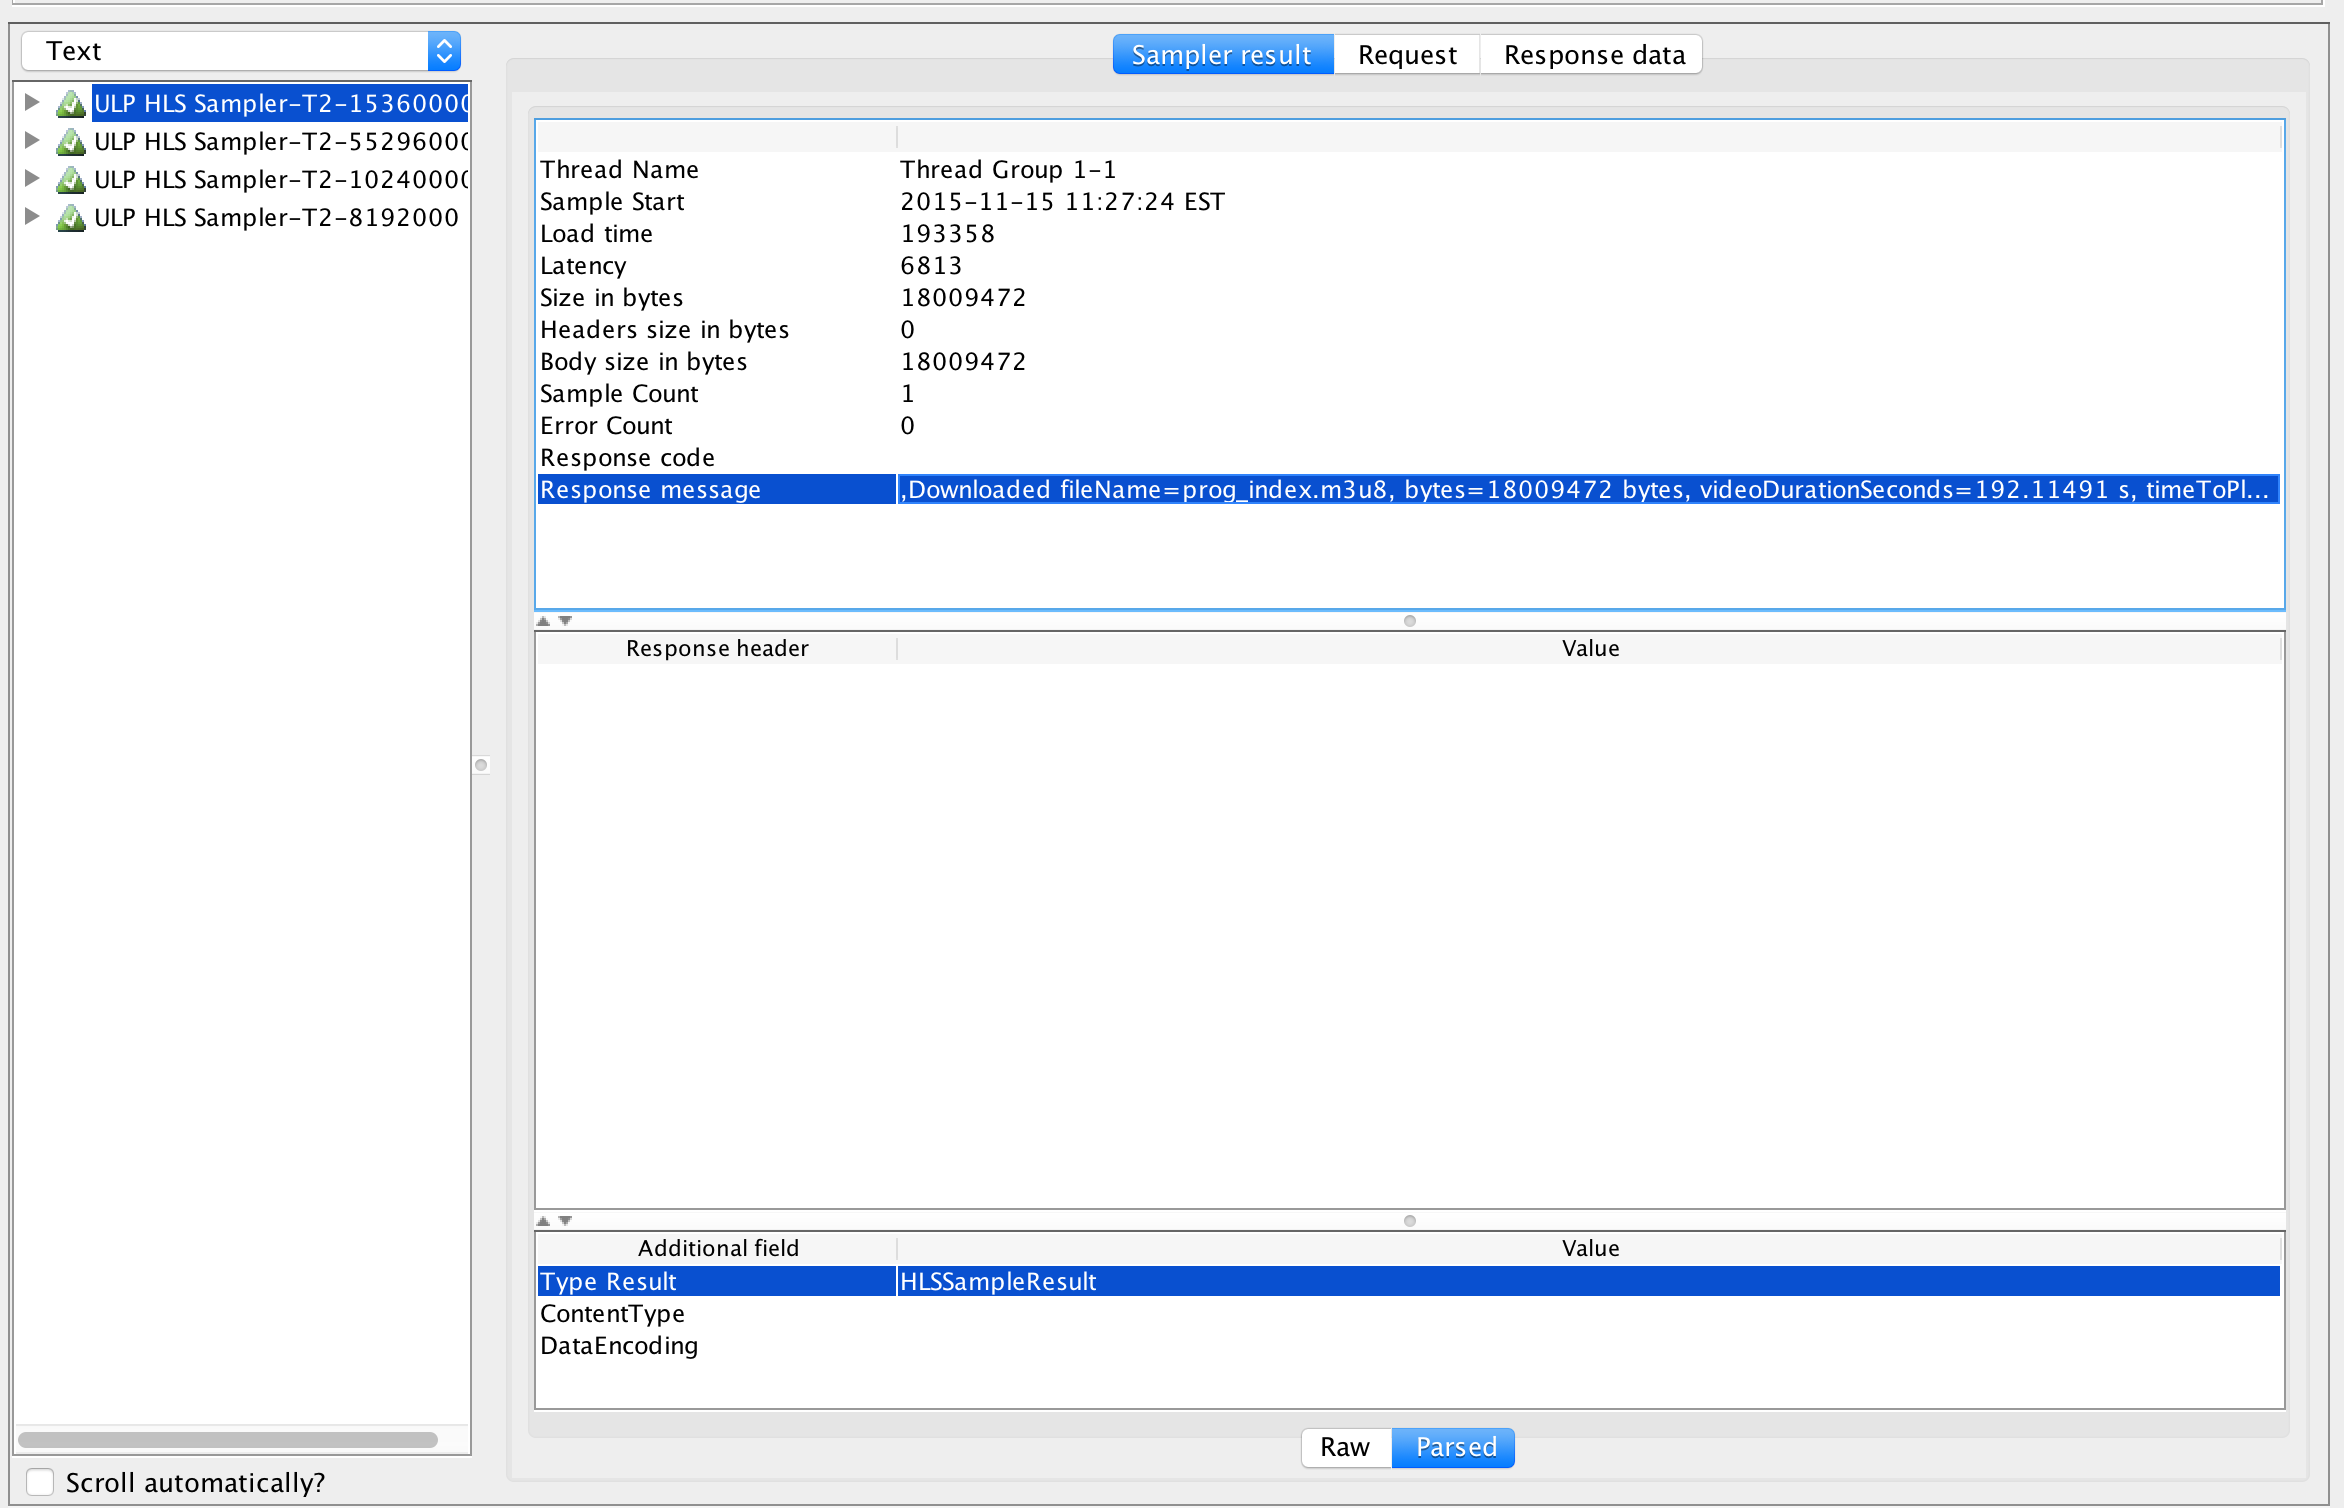
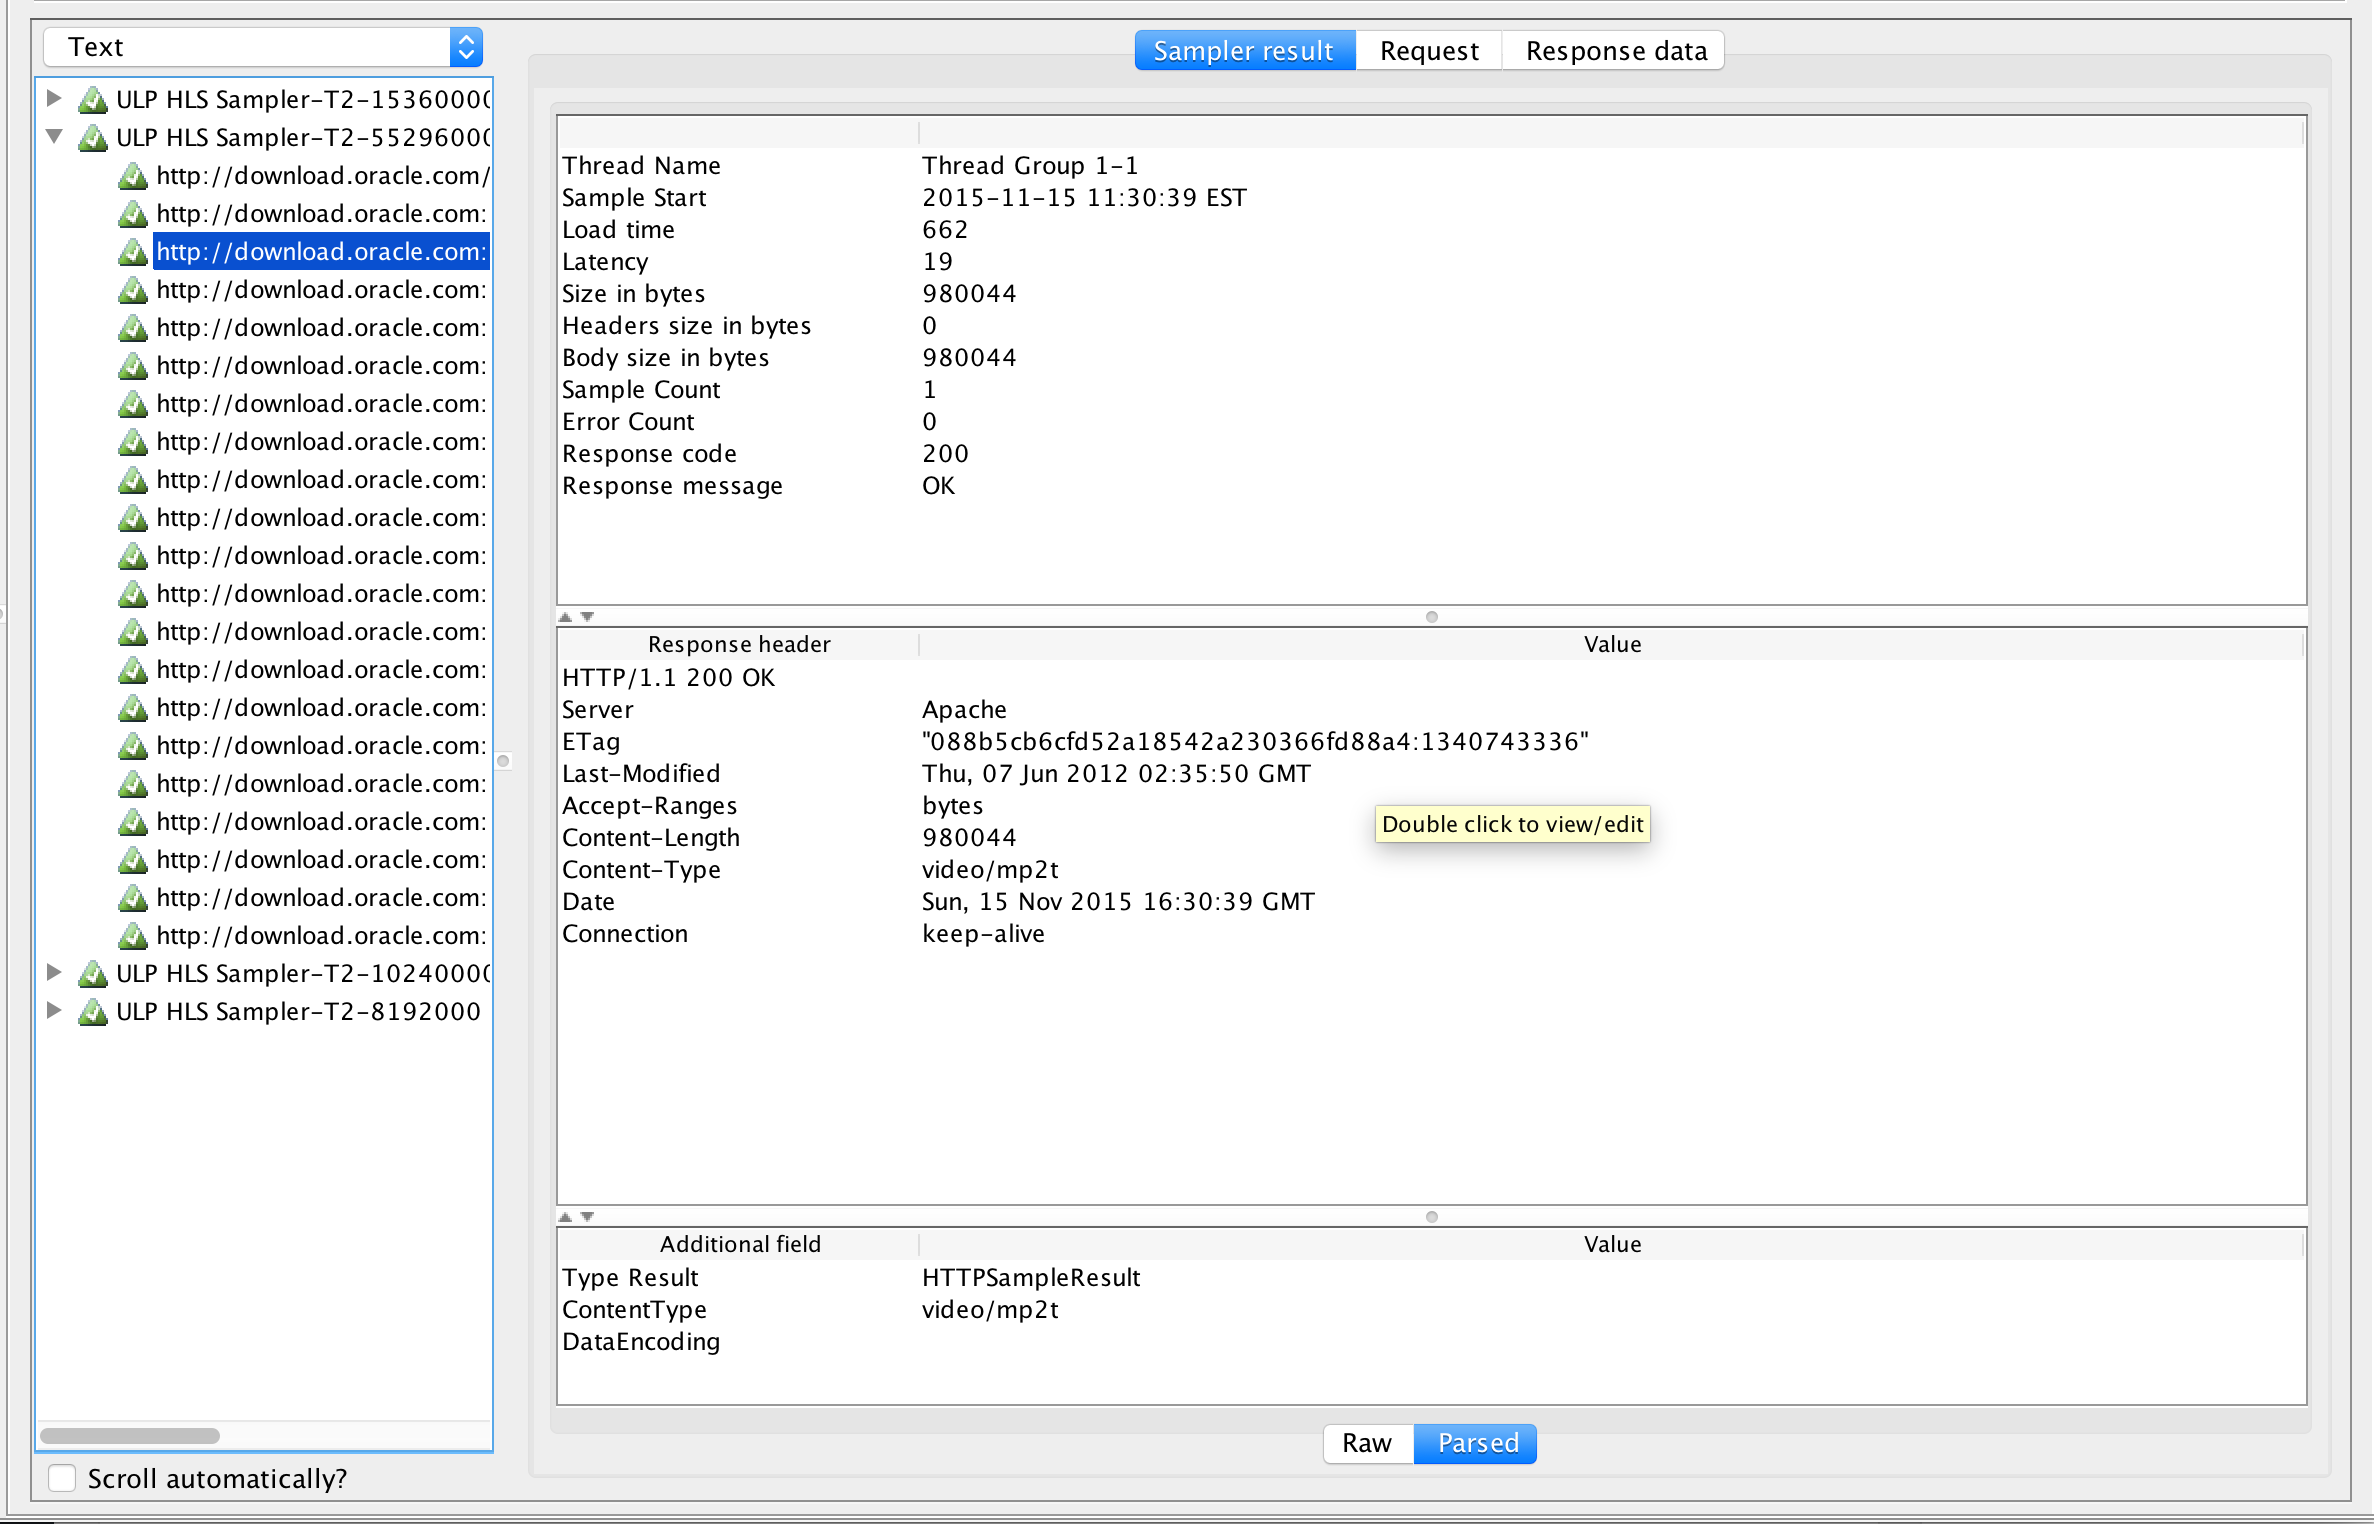
Screen Shot 2015-11-15 at 11.19.01 AM
Child results Child results created in JMeter UI for easy to see videos progress Screen Shot 2015-11-15 at 11.45.28 AM

Scaling the test on RedLine13

We will pick up from their demo taking this tutorial and testing on multiple servers in the cloud.

Example JMX file is available here and bandwidth.csv

This test will simulate 4 requests per server on 9 servers (one in each region), where we change the bandwidth of the request for each of the requests.

Setup input file to be in root director Screen Shot 2015-11-15 at 11.57.30 AM
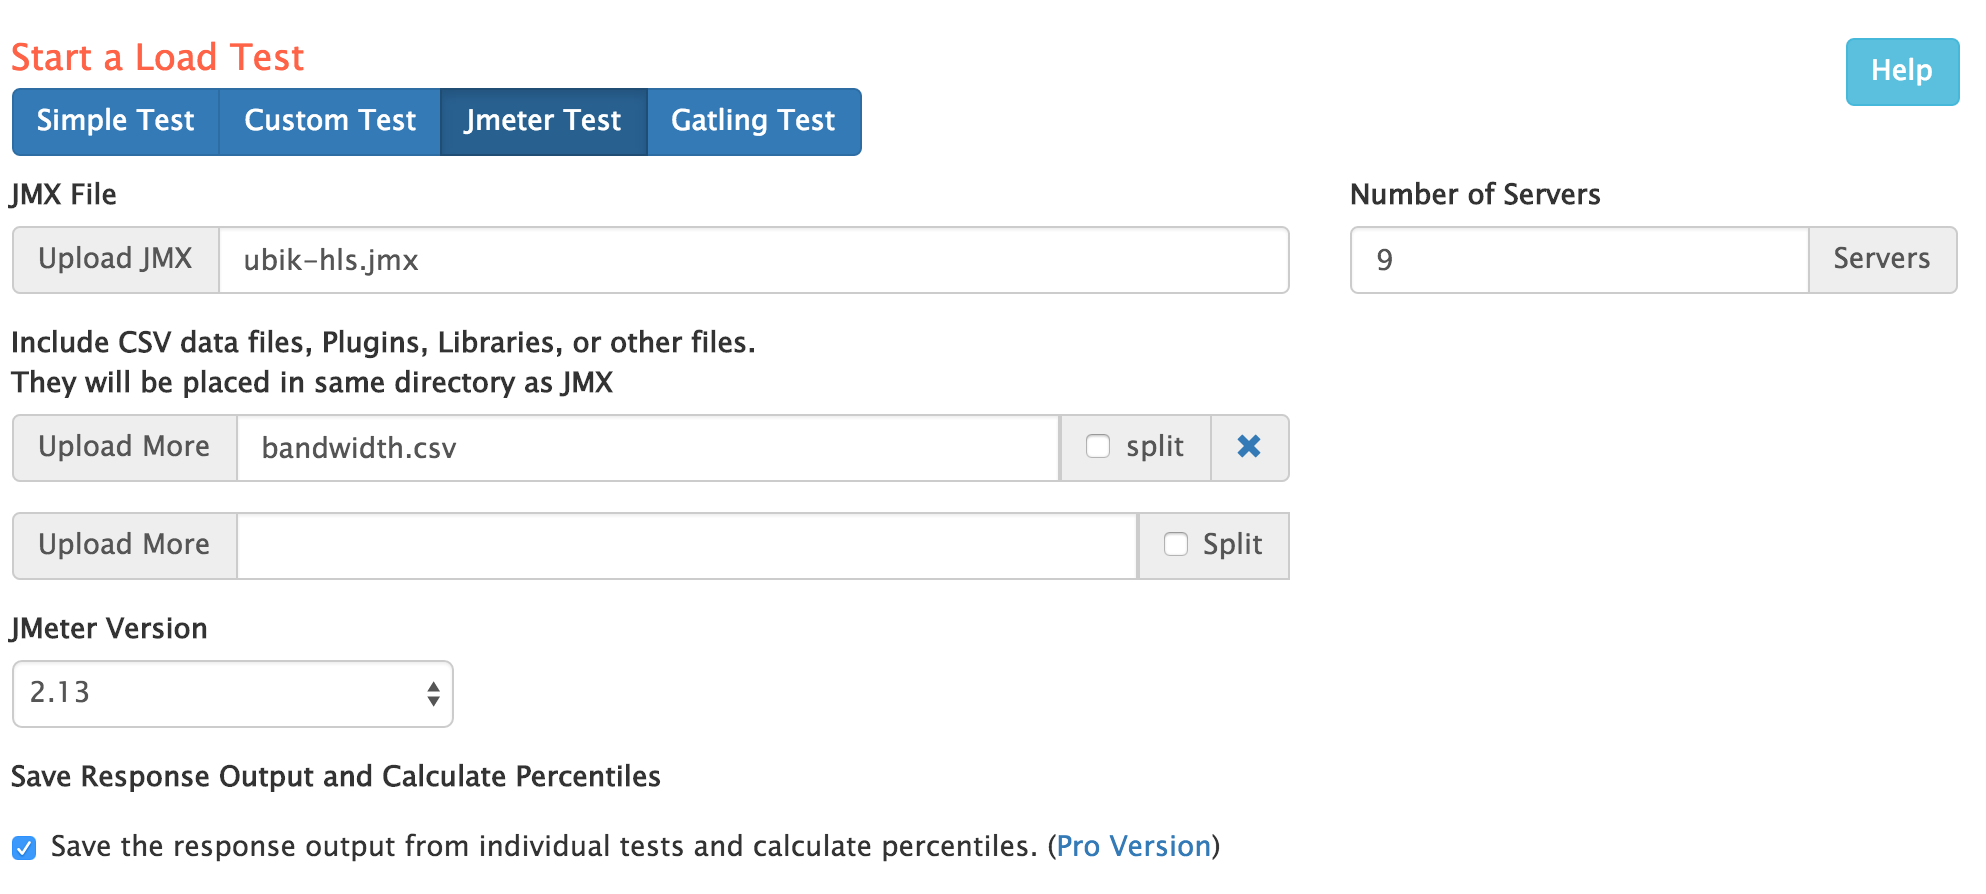
Start Test with this plan

  • Upload Plan
  • 9 Servers (one in each region)
  • attach bandwidth.csv
  • Use version 2.13
  • Save results data
Screen Shot 2015-11-15 at 12.04.28 PM
9 Test Servers

  • One in each region


Screen Shot 2015-11-15 at 12.05.45 PM

Screen Shot 2015-11-15 at 12.05.54 PM

…

Enable Plugin

  • Select Plugin
  • Attach license
 Screen Shot 2015-11-15 at 12.11.55 PM
Start Test

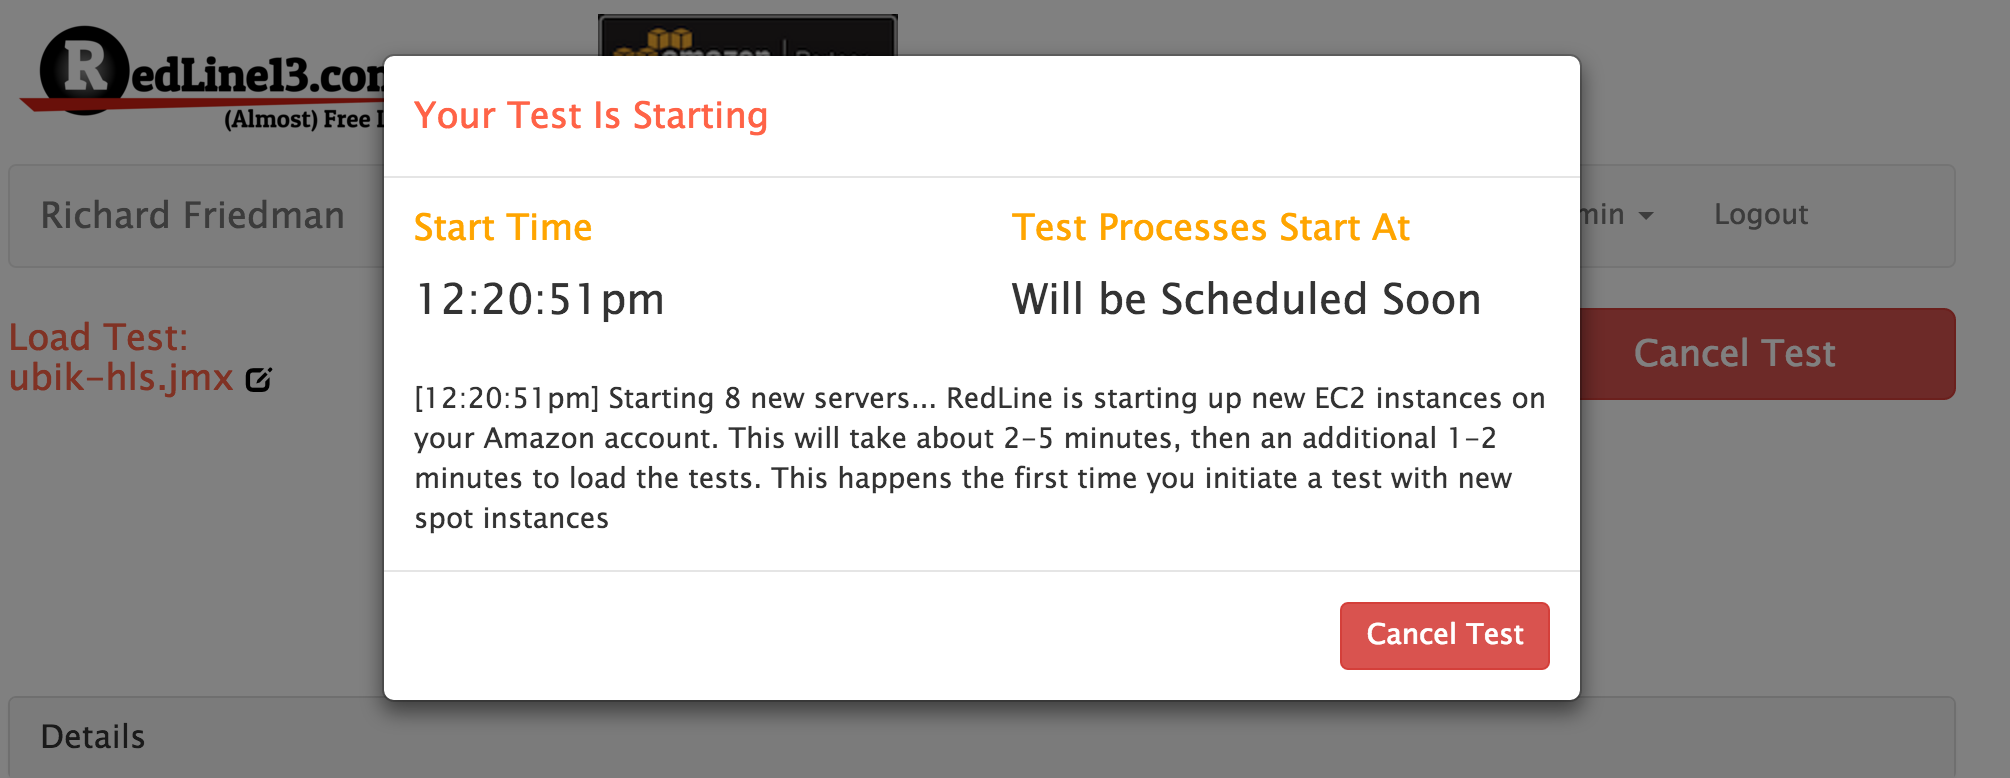
  • Note 8 servers because one region already had a server
Screen Shot 2015-11-15 at 12.20.57 PM
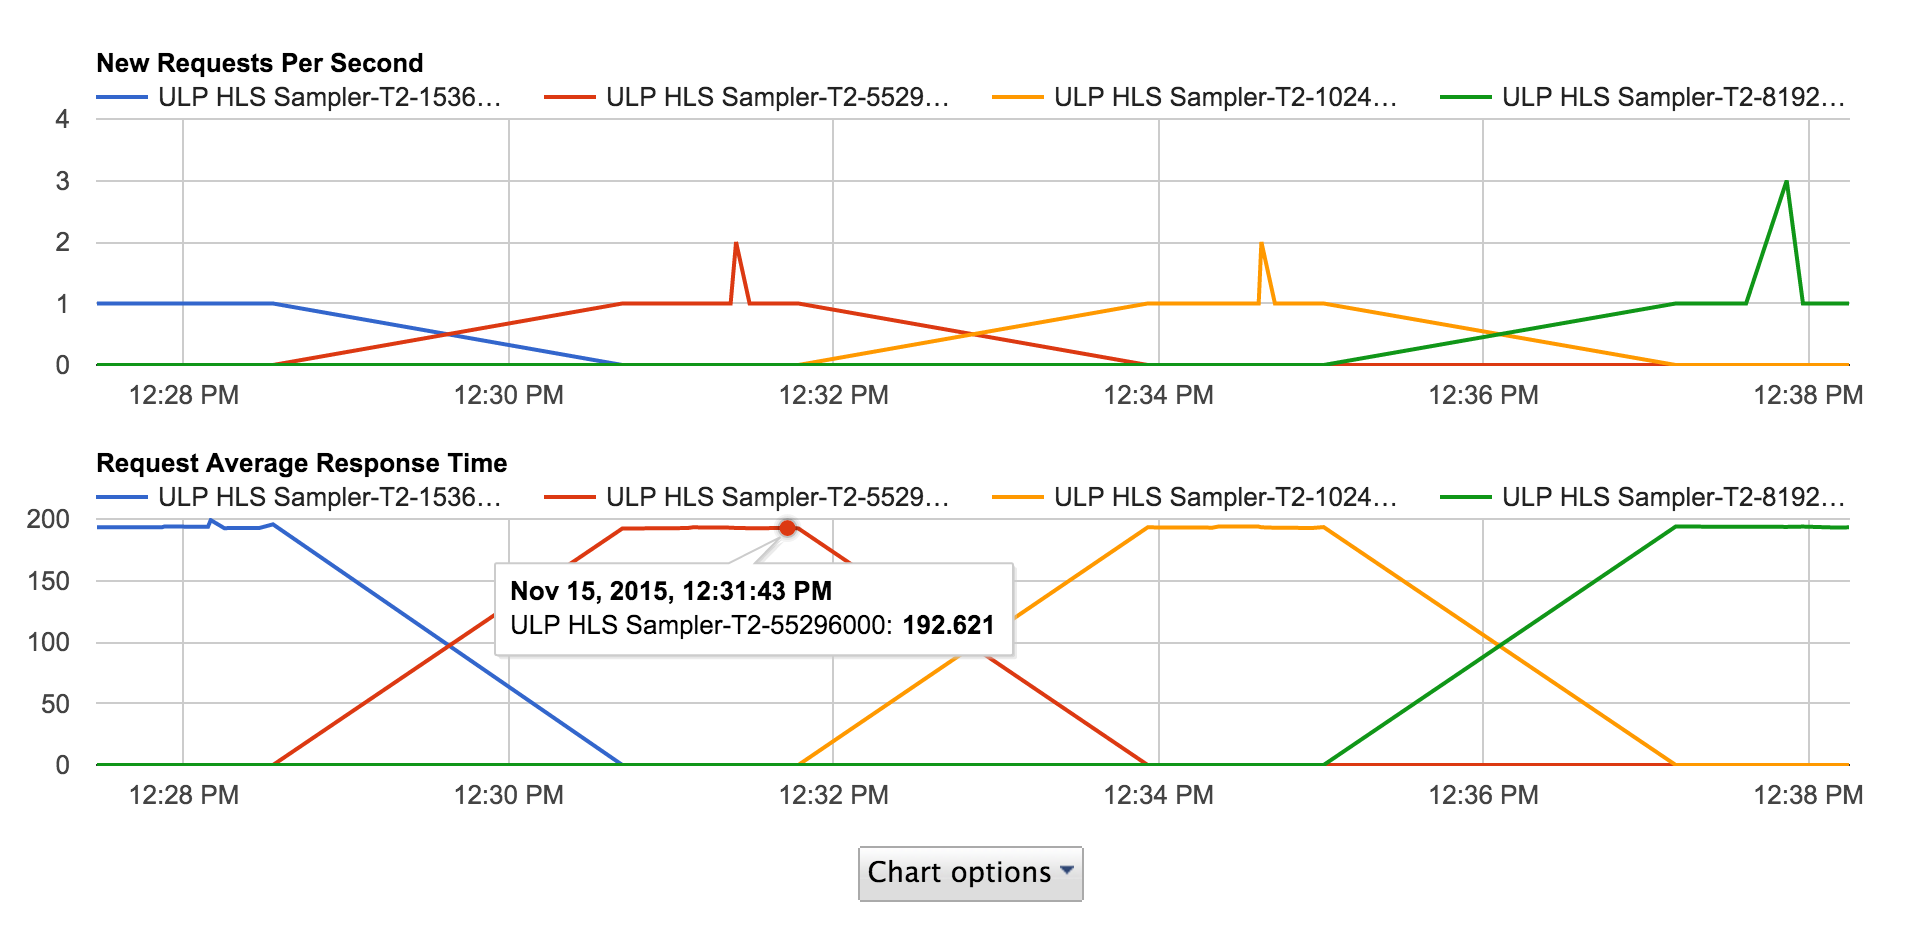
Graph Results

  • Result is the reported time which is the ‘play time’
  • Extra fields in extract have download time
 Screen Shot 2015-11-15 at 12.41.46 PM
JTL Files and Information

  • Examine the custom results
  • Can see custom data points such as download time
 Screen Shot 2015-11-15 at 12.26.16 PM


2015-11-15
Previous Post: JMeter Flex Tutorial with UBIKLoadPack 
Next Post: JMeter GWT Tutorial with UBIKLoadPack 

Recent Posts

  • JMeter XML Format Post Processor
  • Order of Elements in JMeter
  • The JMeter Synthesis Report
  • Using the JMeter Plugins Manager
  • JMeter Rotating JTL Listener

Related

  • JMeter XML Format Post Processor
  • Order of Elements in JMeter
  • The JMeter Synthesis Report
  • Using the JMeter Plugins Manager
  • JMeter Rotating JTL Listener
  • Using Test Fragments in JMeter Tests
  • Step-by-Step Guide to Testing with JMeter
  • Functional Testing vs Performance Testing
  • A Gentle Introduction to Load Testing
  • Using the JMeter Counter Element

© RedLine13, LLC | Privacy Policy | Contract
Contact Us: info@redline13.com

Designed using Responsive Brix. Powered by WordPress.