From the Open Source Load Testing presentation http://www.slideshare.net/richardfriedman/open-source-load-testing
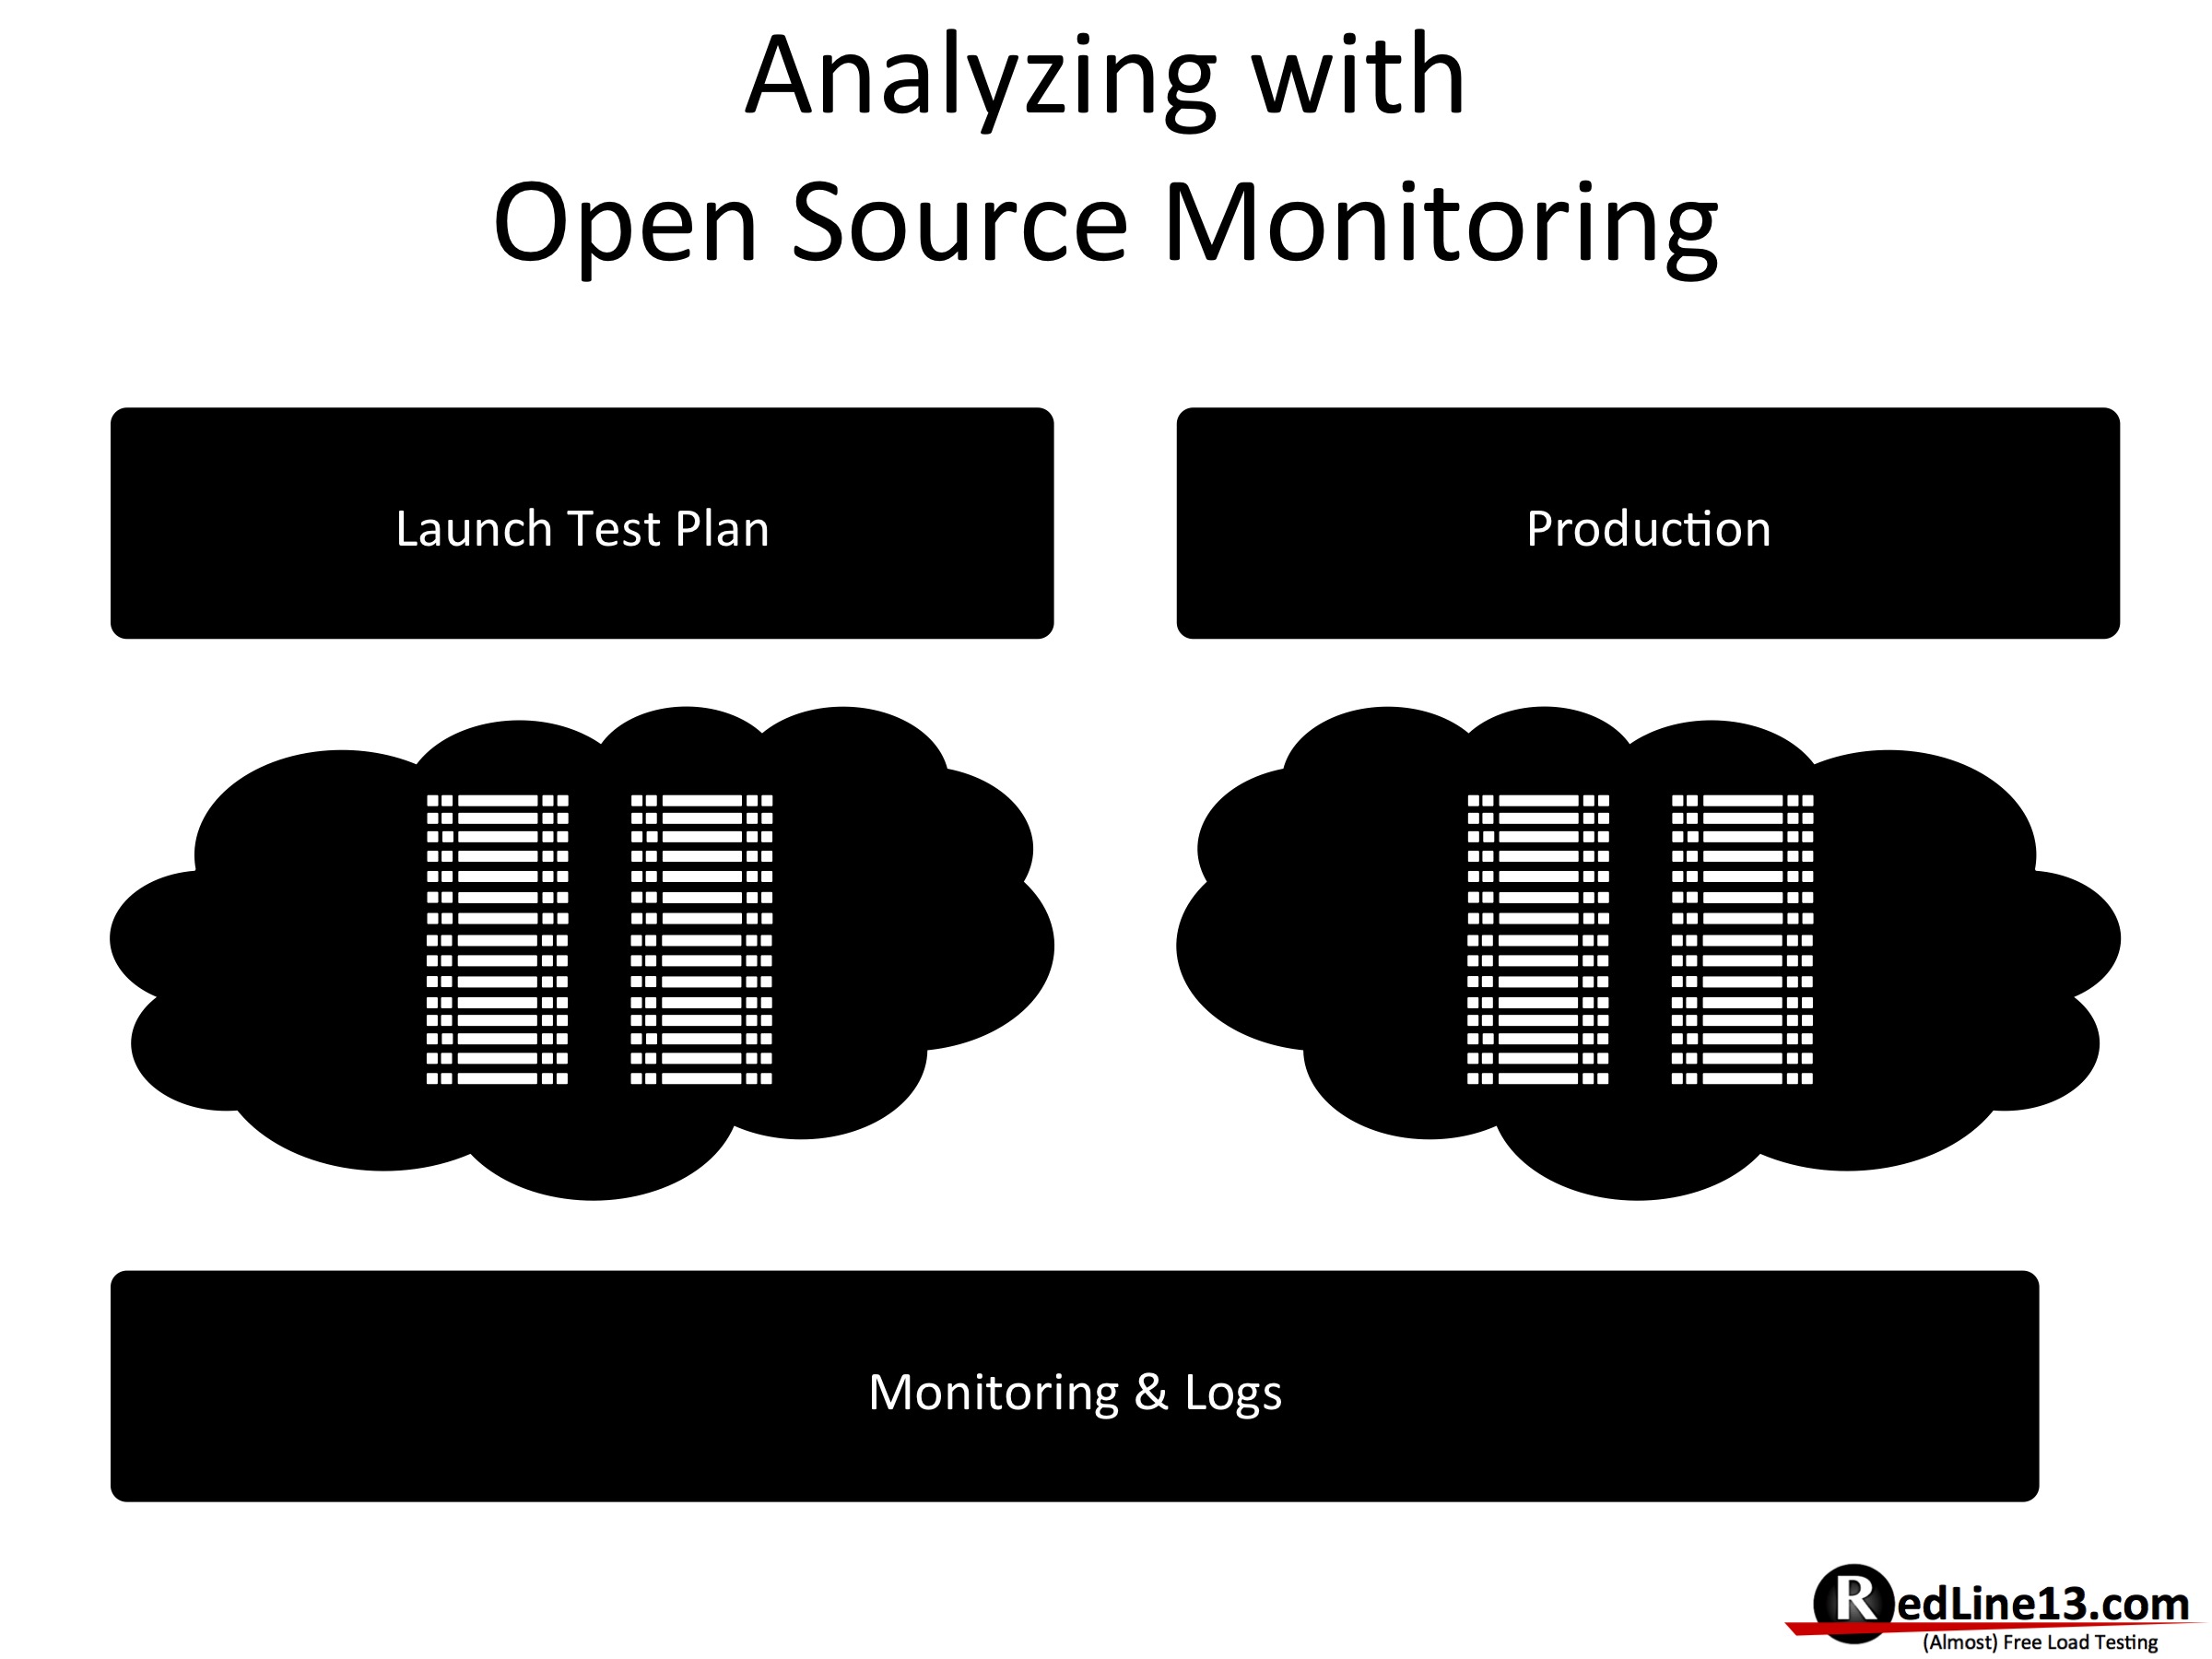
As the running of load tests should fade into the background, the work of analyzing your results starts. We can first look at this from two aspects:
- Load Test Results. Your load test results will show you analysis from a black-box perspective, you can see the overall response time and throughput. If an issue is exposed, where did it happen? Perhaps you are running a LAMP stack – was the issue in the Apache configuration, perhaps hitting limits on your storage, could be an issue in your PHP code, or even all the way down in the connection pooling to your MySQL database. Black box results uncover the issue, you need other tools to be a detective.
- Monitoring. I am a big fan of tools such as graphite and the emerging ELK stack, and have used them to diagnose many a performance issue. Folks at HostedGraphite and raintaink.io are building services for graphite and grafana, they are improving the community, making it easier to use to detect and diagnose. Just as in the load testing community, there are numerous open source projects focused around systems, network, and application monitoring and performance review.
- Commercial Monitoring. I would be a bit remiss not mentioning commercial products here. As this presentation was delivered at FossCon2015 the focus was to discuss achieving results with open source tools. However, I have many times used commercial projects during load testing to hunt and repair bottlenecks. New Relic and Splunk have become a staple for me when running large scale load testing.
No matter the tooling, black box results expose there is an issue, monitoring and performance tools help you do the detailed detective work.