RedLine13 UI Update: RedLine13 Graphs
2019-09-11
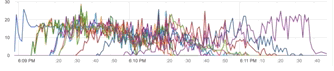
This is one of our most popular blog posts. We’ve updated it again with information you may not know about with real-time RedLine13 graphs. RedLine13 graphs are aggregated from all load tests and can be viewed in real-time. What if you want to see specific time? It’s easy. Just select the time slice in the graph and see it immediately. Check out some of the updates to graphs that we highlighted in the past. After hearingRead More →