We would like to introduce a RedLine13 plugin which supports sending load agent system and process metrics to InfluxDB via Telegraf. There exists a multitude of reasons for wanting to do such, just as one customer has implemented a sophisticated real-time performance metrics dashboard using Grafana.
In this step-by-step guide, we will cover the following:
- Using this plugin
- Using the plugin with JMeter BackEnd Listener
- Available stats
- How the plugin works on load agents
Using this Plugin
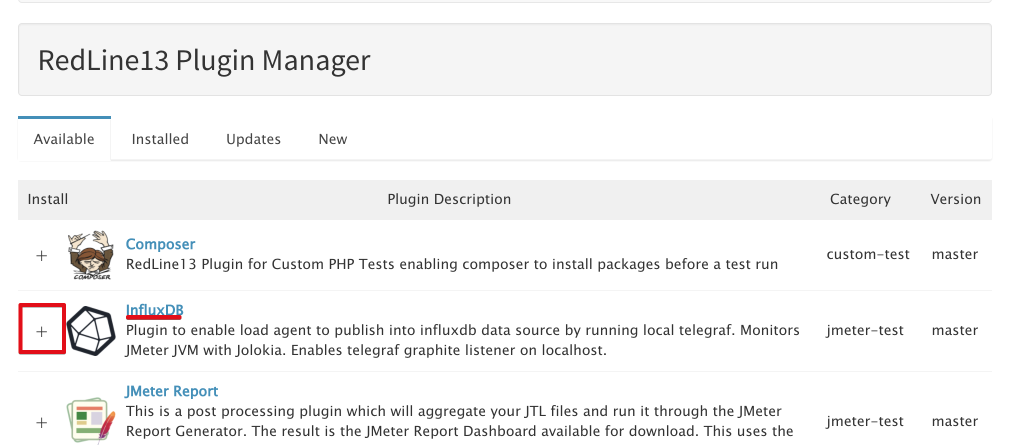
- Go to Plugin Manager from the Account menu and select the InfluxDB plugin to add to your account.
- Create a new JMeter Test (the basic instructions for that can be found here)
- Under Advanced JMeter Test Options, select InfluxDB
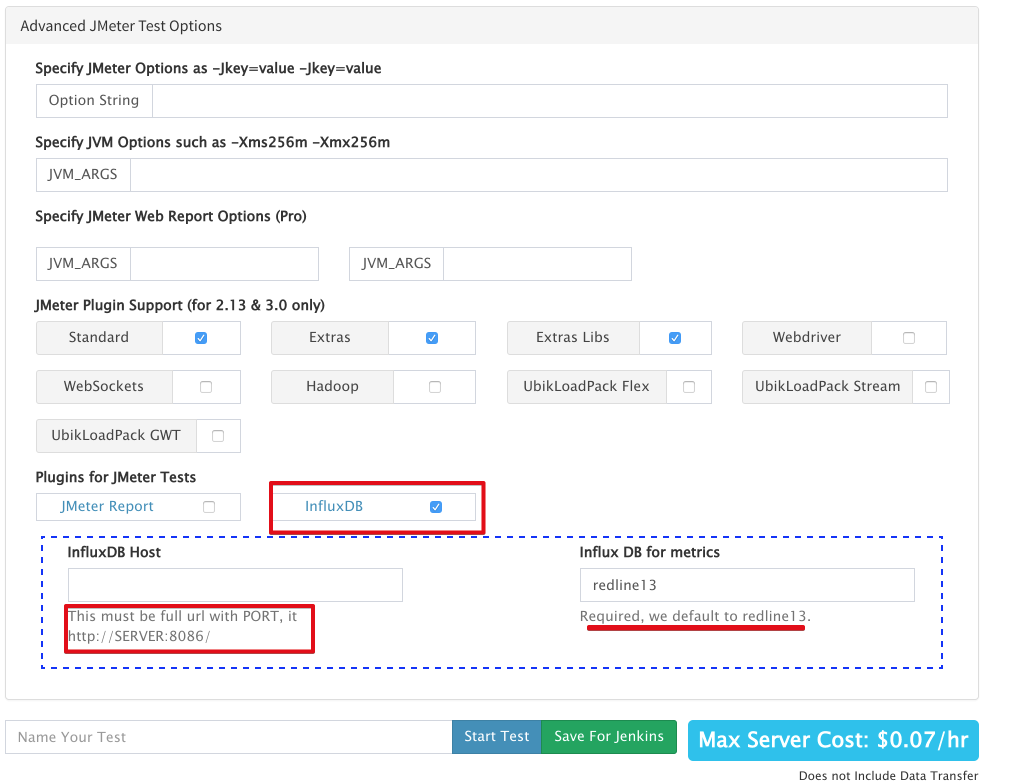
- “InfluxDB Host” – This must be the full URL to the InfluxDB server with the appropriate for port for metrics. The default is port 8086 and usually not HTTPS (reference InfluxDB documentation).
- “InfluxDB for metrics” – Metrics are sent to a “database” within InfluxDB. This allows metrics to be categorized for searching.
We use a default database name of “redline13” to make it easier to find load agent metrics.
- Start your test and wait for some results.
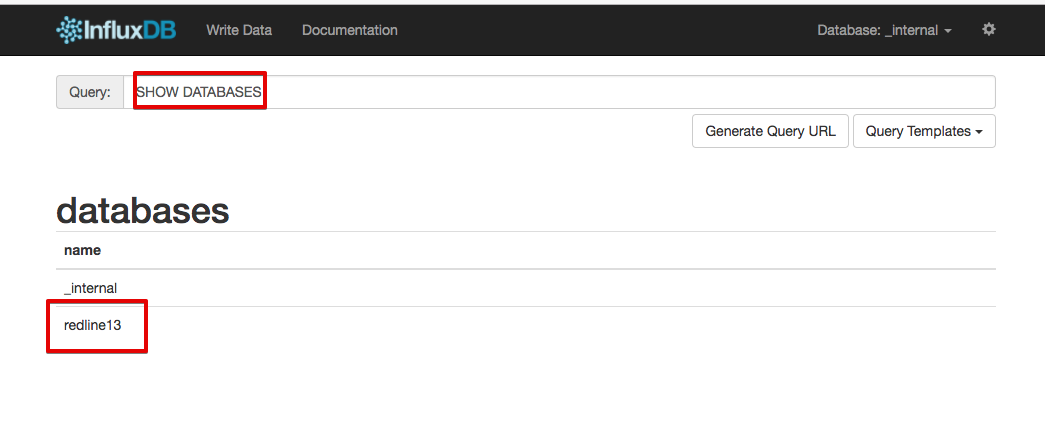
- Validating the data is available via the InfluxDB Admin UI after your test starts
- In Admin UI check if the “redline13” database was created by using the “SHOW DATABASES” query.
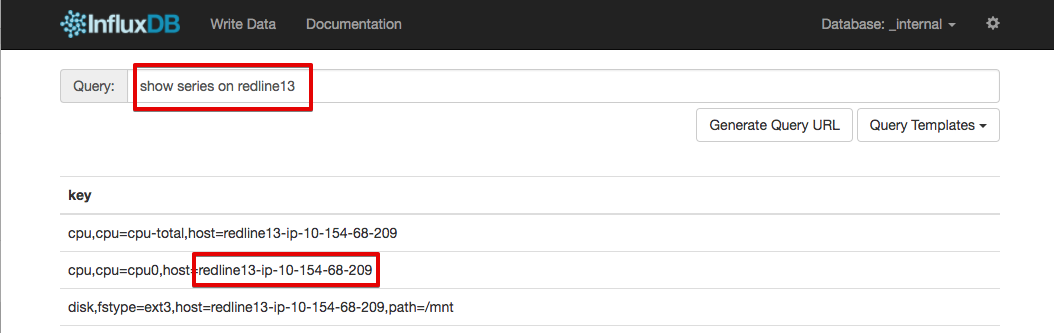
- You may also run the query “SHOW SERIES ON redline13” from the Admin UI to check for metrics from your test.
Note: the host is reported as redline13-[HOSTNAME]
- In Admin UI check if the “redline13” database was created by using the “SHOW DATABASES” query.
- Set up Grafana (optional)
- If you are also using Grafana you need set up your data source and your dashboards.
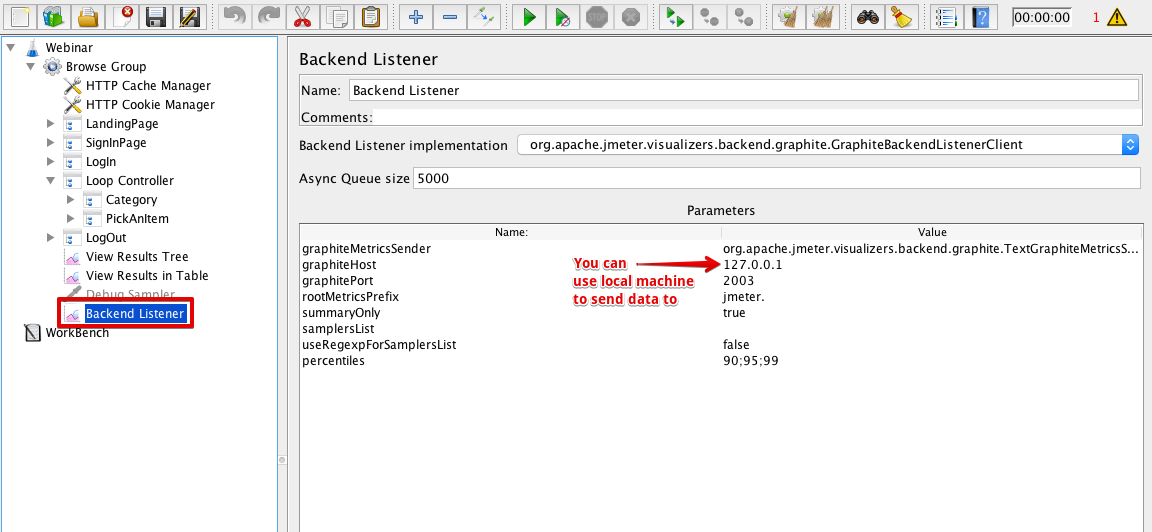
Using the Plugin and a Backend Listener with JMeter
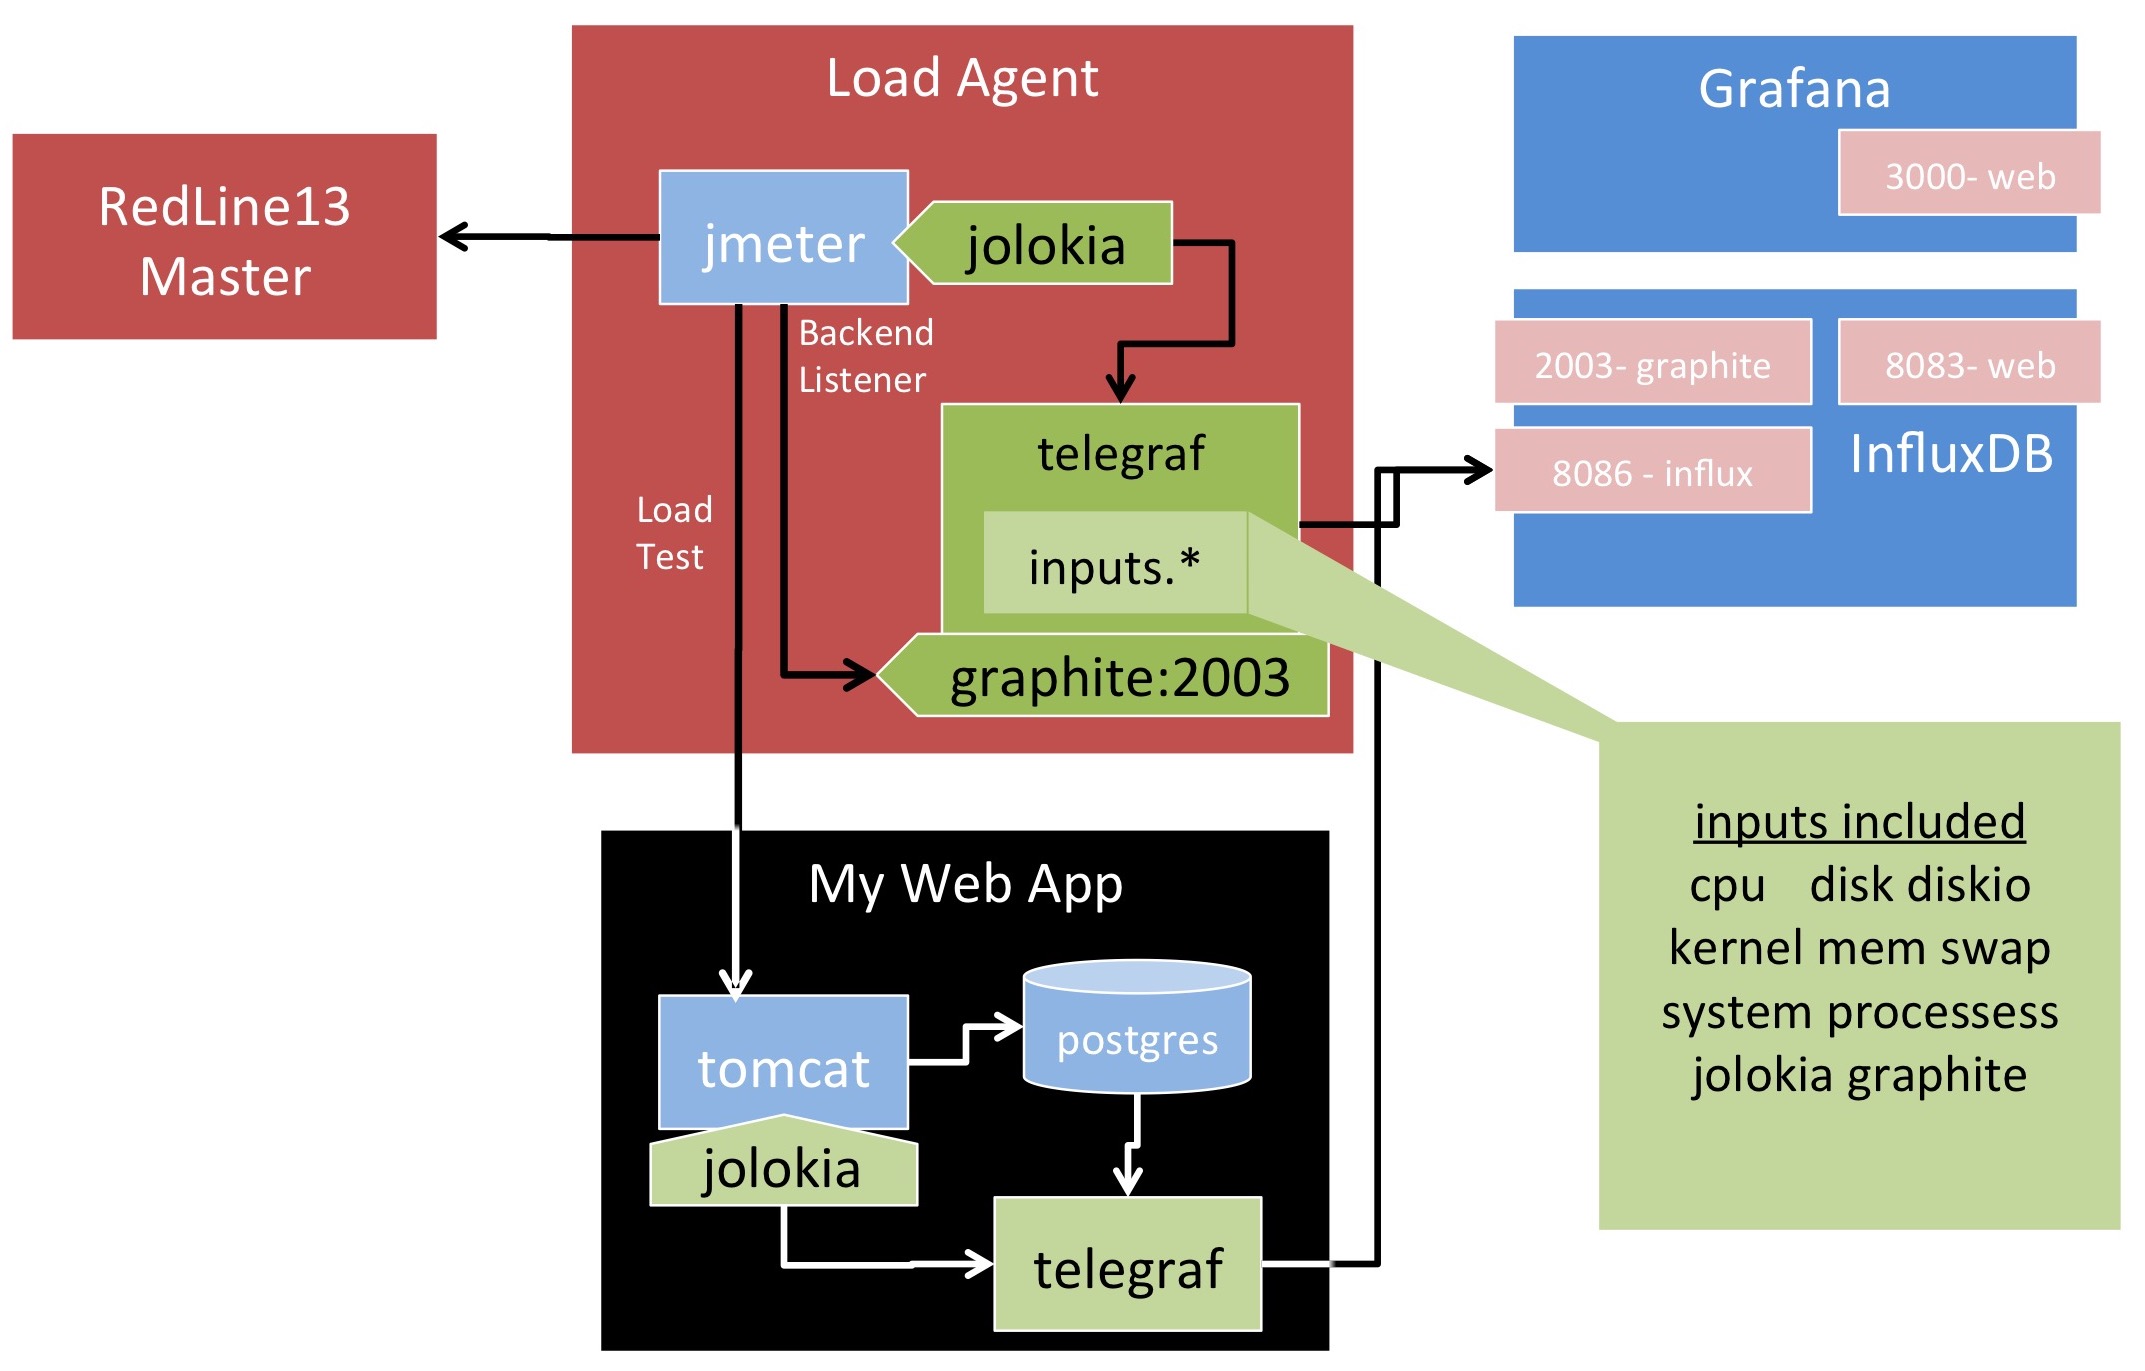
When this plugin is started we also enable the Telegraf Graphite listener port 2003 is opened on the local load test agent. You can configure your JMeter Backend Listener to point to 127.0.0.1 on port 2003 so your Graphite requests will be sent along to InfluxDB through Telegraf.
- In your load test add a Backend Listener and configure the host to be 127.0.0.1
Stats That Are Available
We have three groups of stats:
- System stats from Telegraf including cpu, disk, diskio, process, swap, memory, kernel, and system
- JMeter process stats are collected via Jolokia/JMX:
- We have enabled three mbeans:
- java.lang:type = Memory with attribute HeapMemoryUsage
- java.lang:type = Threading with attributes TotalStartedThreadCount, ThreadCount, DaemonThreadCount, and PeakThreadCount
- java.lang:type = ClassLoading with attributes LoadedClassCount, UnloadedClassCount, and TotalLoadedClassCount
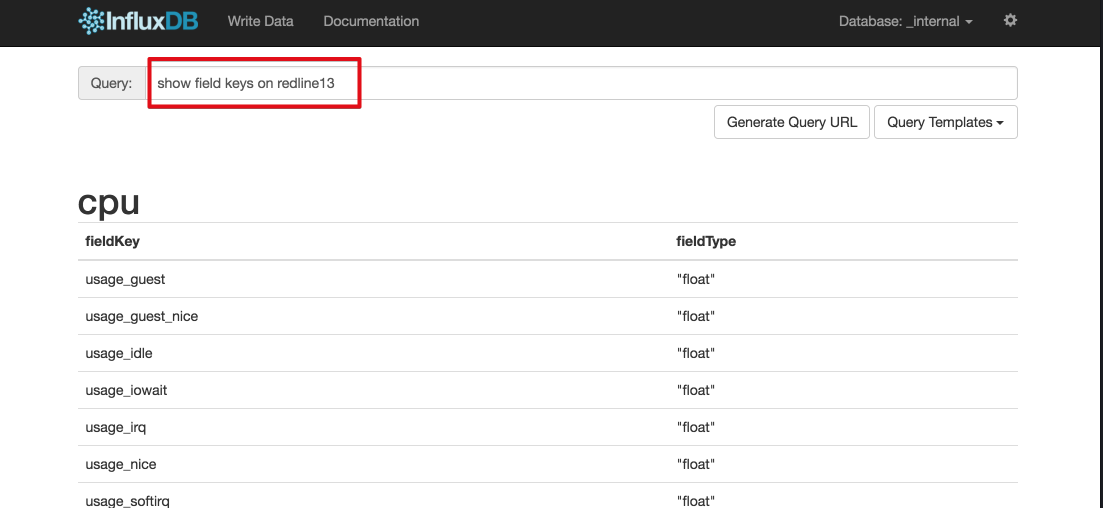
- To see the details you can query “SHOW FIELD KEYS on redline13” from the InfluxDB Admin UI
- We have enabled three mbeans:
- If using a JMeter Backend Listener you can access all of the JMeter metrics in real-time.
- To see a list of properties you can take a look at
- JMeter documentation at http://jmeter.apache.org/usermanual/realtime-results.html
- Run the “SHOW FIELD KEYS on redline13” query from the InfluxDB Admin UI
- To see a list of properties you can take a look at
How the Plugin Works on Load Agents
- On test startup make sure that all the required parts are available and configured:
- Telegraf (v1.1.1) installation
- Jolokia (v1.3.5) installation
- Configure telegraph for inputs:
- Enable Jolokia and configure
- Enable Graphite Listener on port 2003
- Configure Telegraph for user settings:
- Retrieve the database name and InfluxDB host configuration settings
- Update /etc/telegraf/telegraf.conf
- Implement test_start():
- After the JMeter process is started and plugin can act, start Jolokia agent to attach to JMeter process
At this point the load agent is running the test and reporting metrics through to the InfluxDB endpoint.
Plugin source code is available at https://github.com/redline13/plugin-influxdb