
In this post, we will review and compare the different approaches available for comparing two or more JMeter load tests. This is a task we are frequently asked, and the answer often depends ultimately on the requirements of your project. Some of these methods may be used to generate one-off comparisons, while others comprise a system of data collection for comparing many tests over extended runs. We will briefly explain the premise for each of these load test comparison metrics. If you are interested in learning how to use these methods with your RedLine13 tests, please find links for each of these methods below which have been documented with tutorials on our blog.
CSV Comparison 
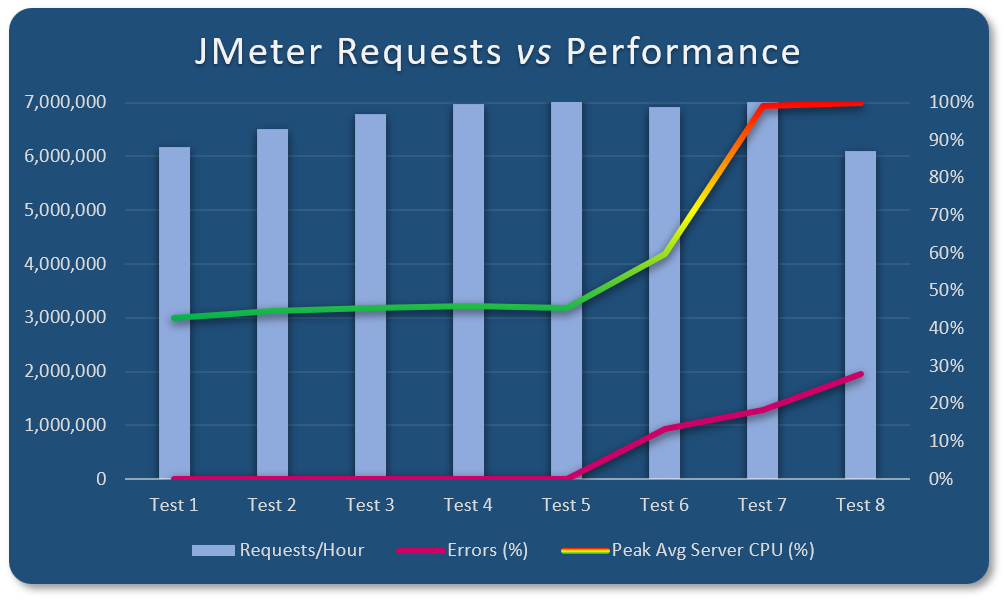
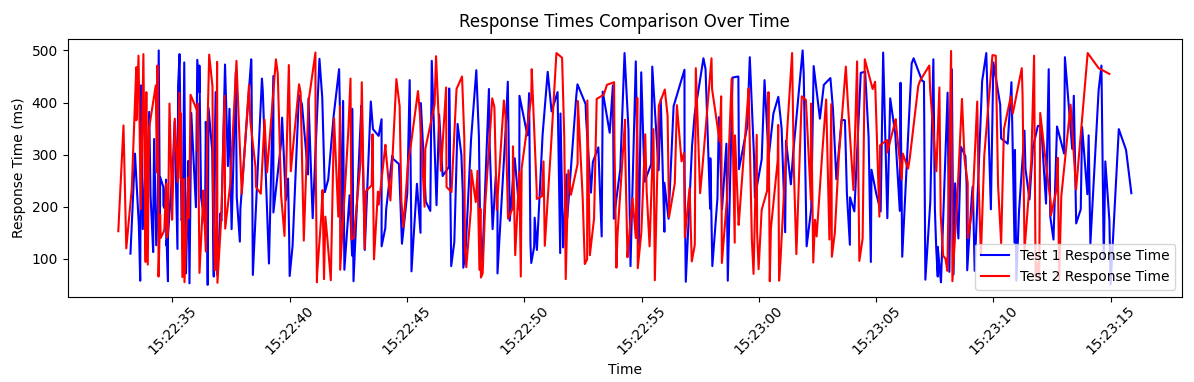
Using a spreadsheet application to analyze JMeter test data is a simple yet powerful method to compare metrics not only within the same test, but also between multiple tests. JMeter saves test results to JTL files, which follow the CSV file format. It is possible to simply rename a JTL file to a CSV file and it can be opened in any spreadsheet application (e.g., Microsoft Excel). We wrote about how to analyze and compare your load tests using CSV files in a previous post. A key benefit is that it lends well to one-off analysis cases as it does not require much in terms of infrastructure to set up. In addition, graphs and other visualizations can be easily created from spreadsheet analyses. Here is one example of a graph which was generated directly from a series of JTL files from high-throughput JMeter tests:
Third Party Data Analysis Tools 
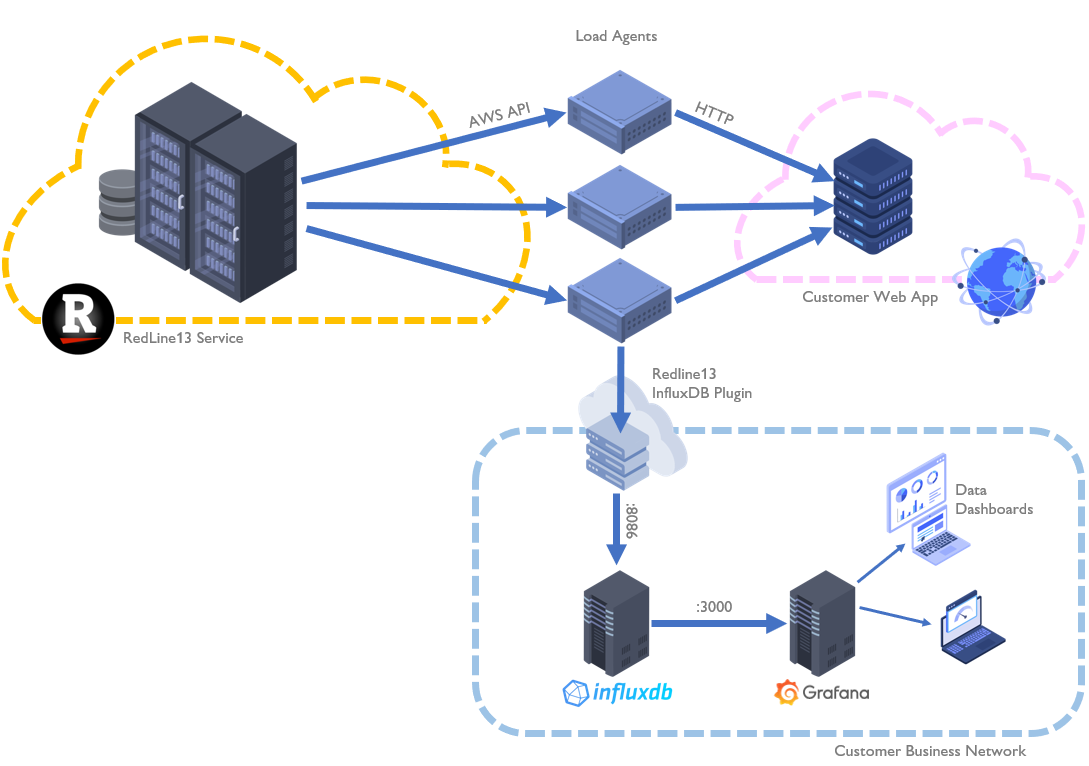
For more advanced analysis, data from tests can be streamed into a database which can later be queried to synthesize reports. These include tools such as InfluxDB, Grafana, Dynatrace, and others. One of the ways that you can achieve this with RedLine13 is our built-in InfluxDB plugin. This approach extracts and saves real-time test metrics to an InfluxDB time series database:
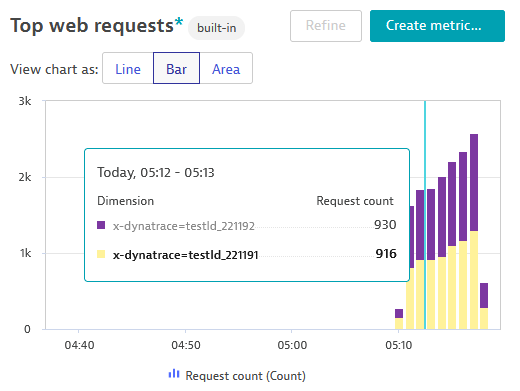
Another method is to leverage Dynatrace as we have also discussed in a previous article. While operating on a similar premise, Dynatrace integrates into your JMeter script more explicitly. There are several ways in which this can be accomplished, and in the example we covered on our blog we opted to use embedded HTTP request headers. Depending on your particular requirements, you may find this fine-grained level of data analysis useful.
JMeter Merge Results Plugin 
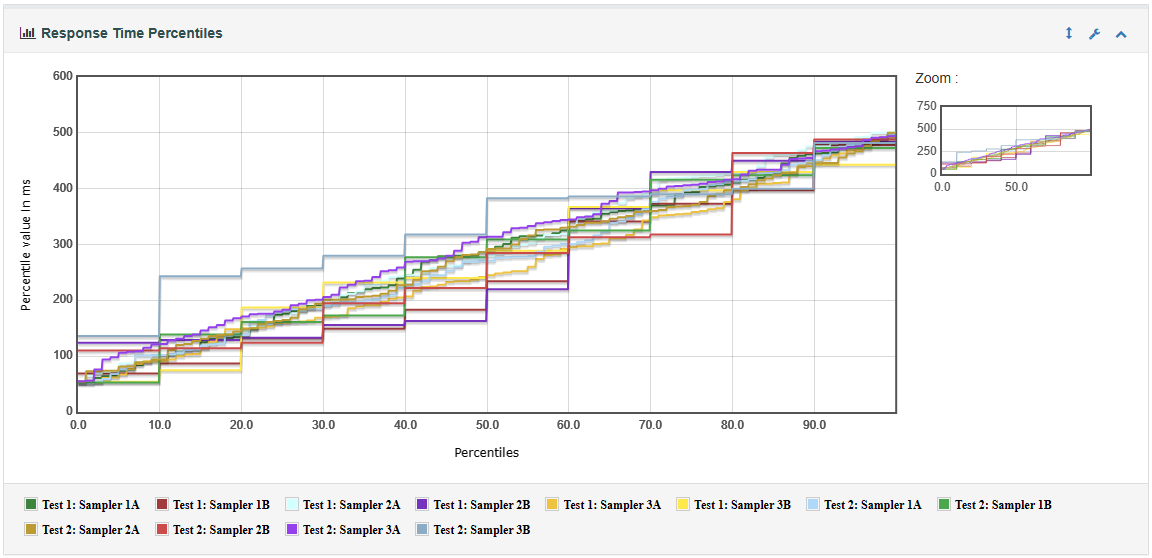
There is built-in functionality within JMeter which allows two tests to be compared after execution. This approach can leverage the JMeter Dashboard Report in that it can perform comparisons on two or more JMeter tests using. It has the advantage of using all the familiar ways to compare tests as ordinarily reported on for single tests. In addition to this, it can also normalize timestamps such that two test runs from different times can be directly overlaid onto the same graph.
AI Assistants (ChatGPT) 
There are at least three use cases for ChatGPT when it comes to analyzing load test data. One is to automate tedious or repetitive processes. Another is to perform one-off or generalized analyses, such as when the model is given data points and asked a question. A third and arguably more robust use case is tasking the model to create reusable scripted components for creating reports and graphs. In a recent blog post, we walked through each of these use cases in that particular order. We arrived at the conclusion that ChatGPT (as our AI model of choice) demonstrated its adeptness at creating analysis scripts in seconds that were reusable across many tests.
Did you know that RedLine13 offers a full-featured, time-limited free trial? Sign up now and start testing today!