RedLine13 provides detailed real-time and post-test metrics, but there may be certain cases where you want to compare load test results. In this post, we will discuss some of the ways you can compare metrics both within the same test, and between multiple tests.
Compare Results from Multiple Load Tests
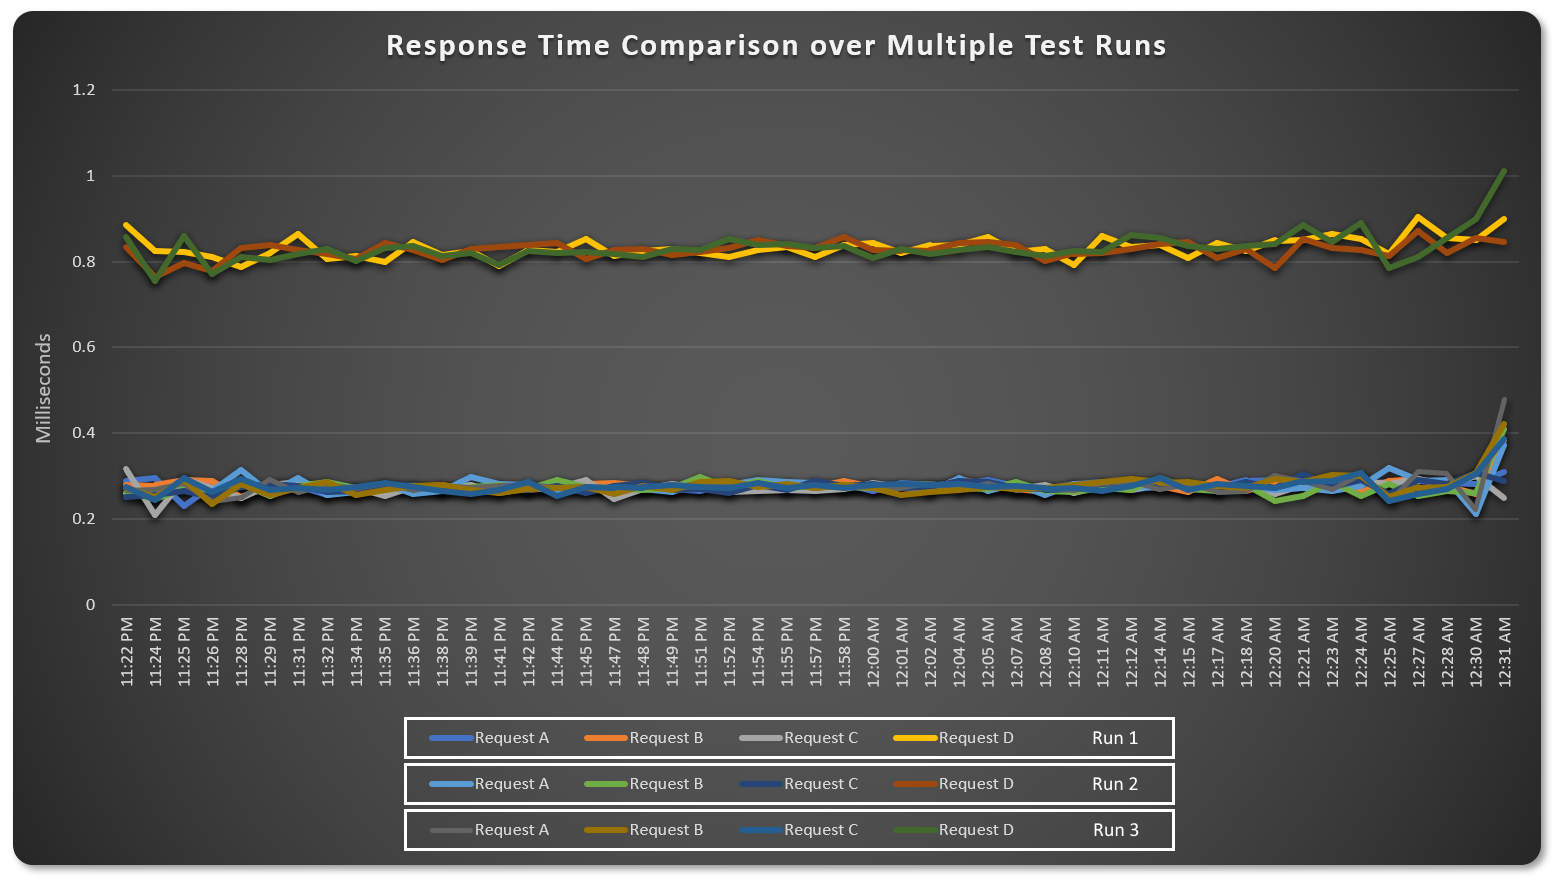
It is possible to compare results between multiple test runs by combining exports and using a spreadsheet application like Excel. Below we have a graph which combines request response times for three different test runs. One reason why we might do this is to ensure that our test is reliable and produces the same results over multiple runs.
Working with Exported Results
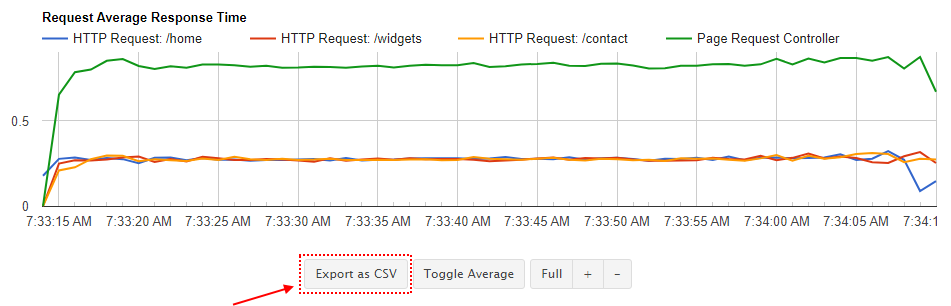
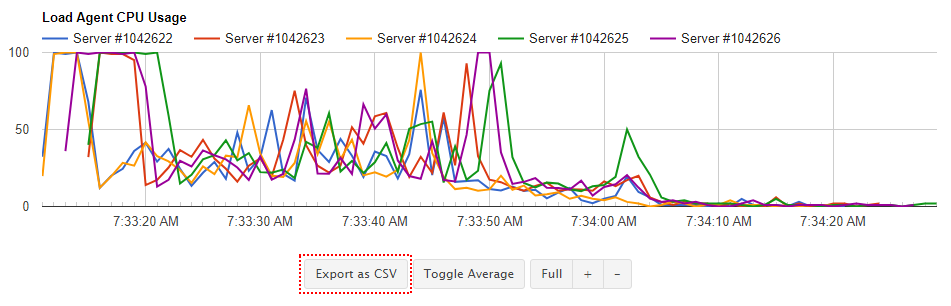
You can easily export many graphed metrics simply by clicking on the “Export as CSV” button for the particular chart you want. (We will also discuss more advanced exports directly from JMeter later.) The above graph shows average response times which are specific to the test results. Additionally we expose graphs for load generators such as average CPU usage shown below:
The graphs that you chose to export will depend on the type of analysis you are conducting. Data from exported graphs is focused and concise for your convenience. There are other options we provide if you need more advanced data exports.
Structure of RedLine13 Exports
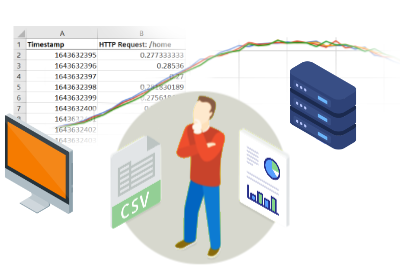
Clicking on the “Export as CSV” button will download a comma-separated values (CSV) file. The format of this file is straightforward. In the first column there will be a “timestamp” value which is a numeric representation (epoch time) of when the data point was sampled.
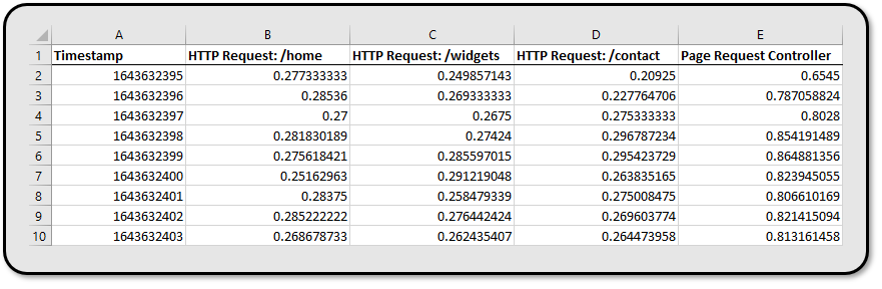
To do useful analysis on this data, convert the raw timestamp with programs such as Microsoft Excel, which can easily convert this time into a more human readable format.
The formula for the time conversion in Excel is:
=(VALUE/86400)+DATE(1970,1,1)
Compare Results from Multiple Sources within the Same Test
Once you have the data and converted date and time in a program like Excel, it is possible to run some interesting derivative analyses.
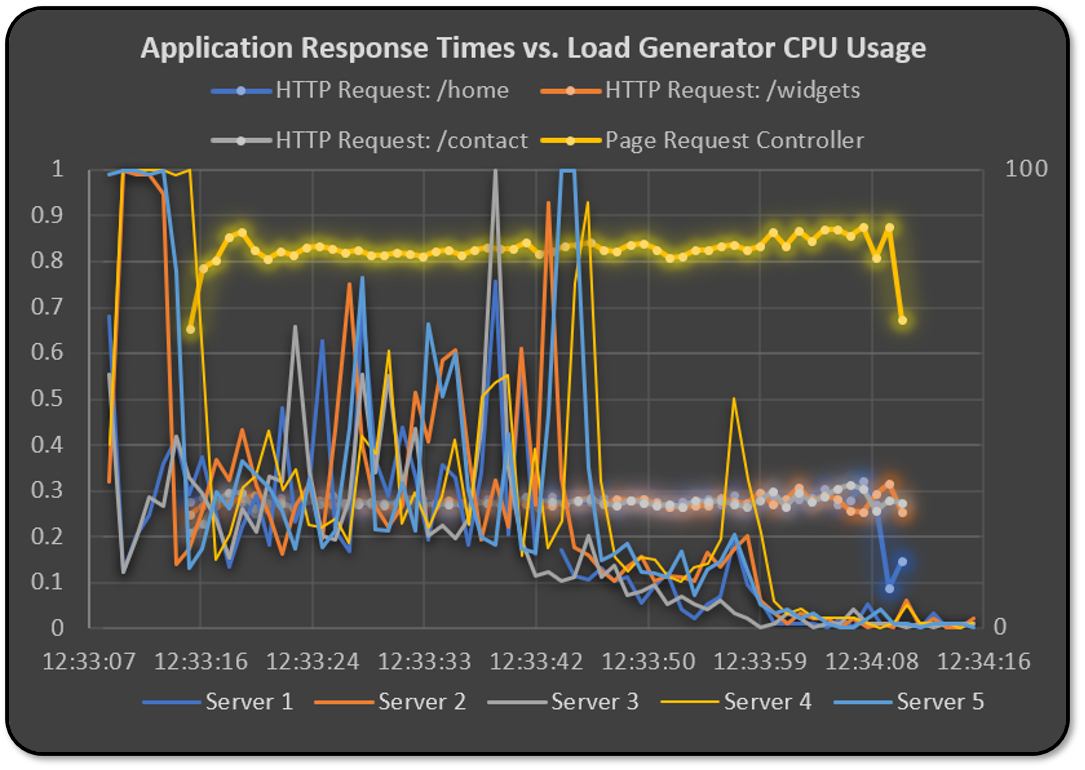
In this basic example, we can compare response times from requests within our tests side-by-side with load generator CPU usage. This lets us analyze to see if there is any correlation between the two. If true, this would suggest response times are artificially high due to load generators becoming overloaded. The above graph does not indicate this, and therefore substantiates our results in this regard.
Accessing the Raw Data
When you run a test with RedLine13, we give you the option of saving all of the raw data for the purposes of doing your own custom analysis. To enable visibility of this at the end of your test, you’ll need to ensure you select this option before your test runs:

With response output saved, you can find several new options under “Output Files” shortly after your test concludes. Here you will find the option to download or view your JMeter Dashboard Report. Just below that, we present the option to download a “Generated Merged JTL” file:
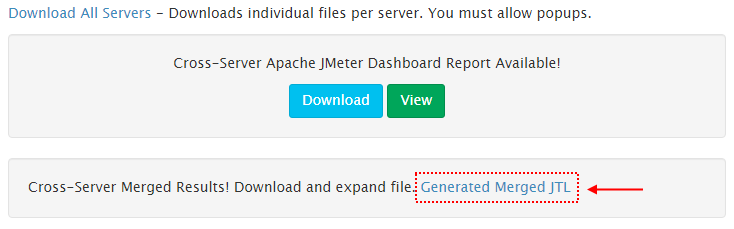
Essentially this JTL file is the full raw JMeter test output in CSV format. You can open this file directly from a program such as Excel and perform similar analyses as the CSV exports we have described above. The difference here is the added data which is available. Here you can find the HTTP response code, thread name, bytes transmitted, response times, and much more. Each row is similarly time coded in epoch time, meaning that load generator metrics like CPU and memory usage can be overlaid as shown in the example above.
More Data with Integrations
In terms of the types of analyses most businesses need, CSV suffices remarkably well. However, we do understand that more specialized applications might require a deeper analysis including external metrics. For these cases, we have a few recommendations. An application performance monitoring (APM) framework such as Dynatrace will allow you to custom instrument your tests. In another post we have covered how to integrate with JMeter and get metrics from your tests into Dynatrace. Another solution would be to capture additional metrics with the time series database InfluxDB. RedLine13 offers a plugin for this tool, which can in turn integrate with visualization software like Grafana. We have in fact covered one customer’s experience where they used this in their load tests.
RedLine13 offers a full-featured free trial that gives you access to everything we discussed in this post. Sign up now and start testing today!