
Most examples that illustrate how to create a k6 load test center around using a bottom-up approach with code. This is in contrast with frameworks such as JMeter where it is typical for tests to be created visually. However, there is a utility by Grafana Labs for creating k6 load tests with a GUI. In this post, we will show you how to use the graphical Test Builder to create k6 load tests.
The Graphical k6 Test Builder
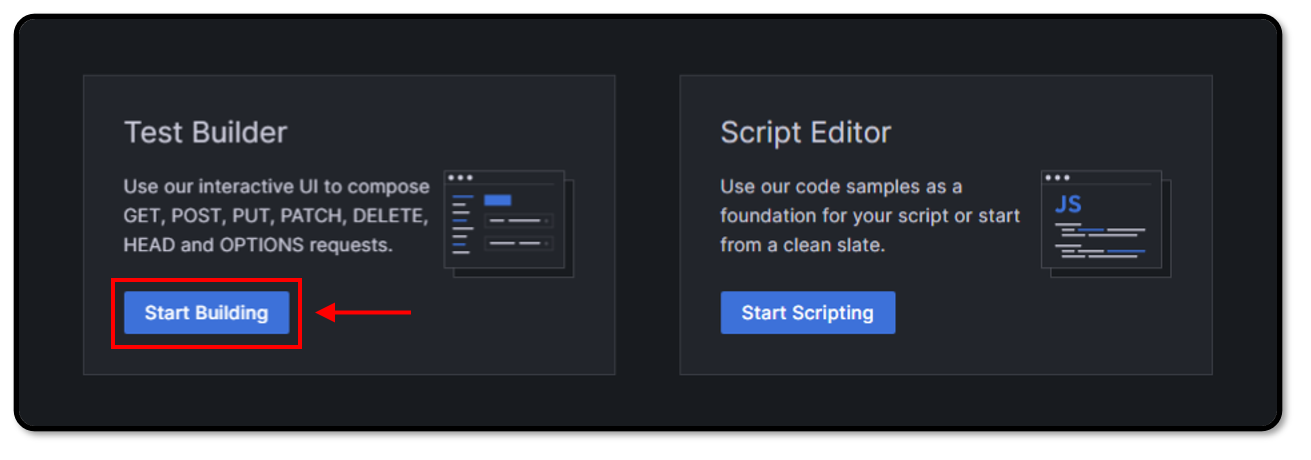
In order to take advantage of this tool, you will need a Grafana account. If you don’t already have one, you can create one on the Grafana Labs website. Once you log in, the Test Builder can be accessed when creating a new test plan for a project:
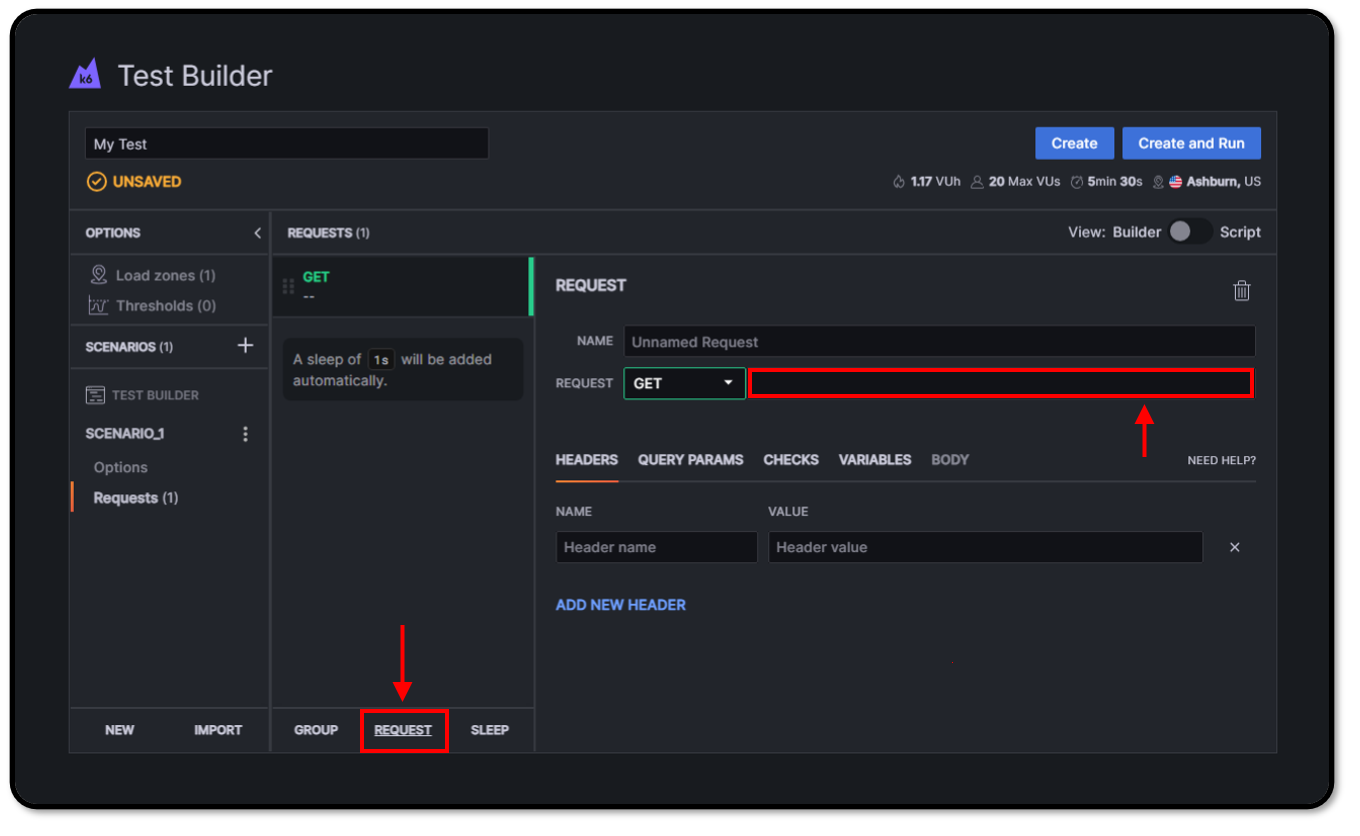
From there, you can add requests and other elements such as groups, and sleep intervals. Below is an example of adding a single request to our test plan:
Configuring Requests
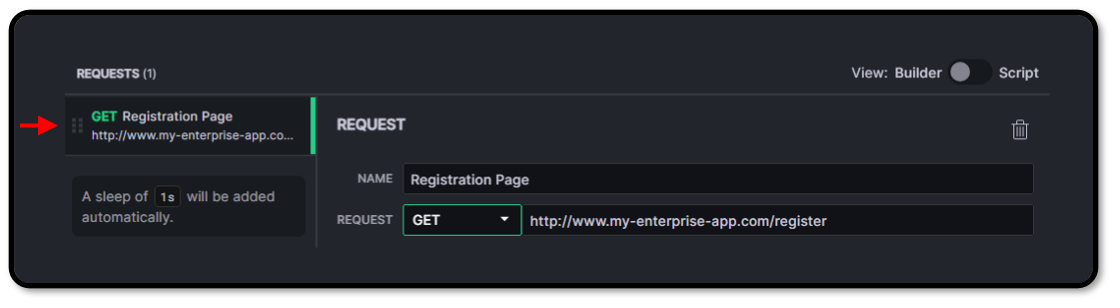
Let’s go ahead and create a GET request to the /register endpoint of our hypothetical enterprise app. With the Test Builder, this is as easy as typing in the URL to our target test page, and for convenience, giving our request a friendly name. You can see that our request immediately displays on the left as part of our test plan.
Using this process, we can add as many requests as we want – we can even group them together and add other elements to control test logic flow.
Exporting Test Scripts
Once we are satisfied with our test, we can slide the view selector from ‘builder’ to ‘script’ which will allow us to view the underlying k6 JavaScript that the Test Builder has created:
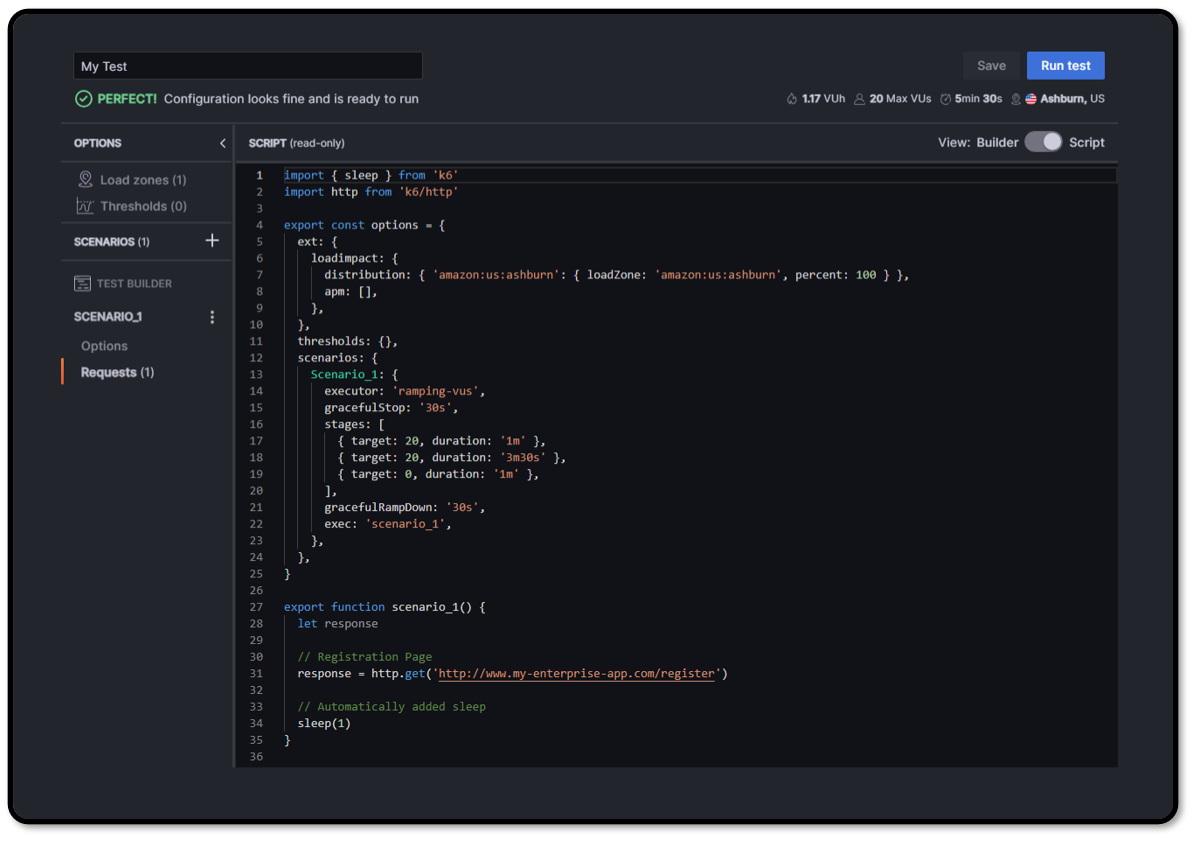
While the code that is generated will be read-only inside the Test Builder app, you can port this script to your favorite code editor and modify it. This can accelerate many basic tasks, and can greatly simplify the amount of code that must be written by hand for common operations.
Did you know that RedLine13 offers a full-featured, time-limited free trial? Sign up now, and start moving your testing into the cloud today.