
When you begin running a test with RedLine13, our streaming results make it easy to monitor the performance of your JMeter test in real time. Those results are updated with even more detailed information once your test completes. Another useful feature available in our Premium plan includes the ability to view the JMeter Dashboard Report directly from your browser. You can read more about this report in the JMeter official documentation. There are many use cases for this report, and we discuss several of them on our blog here.
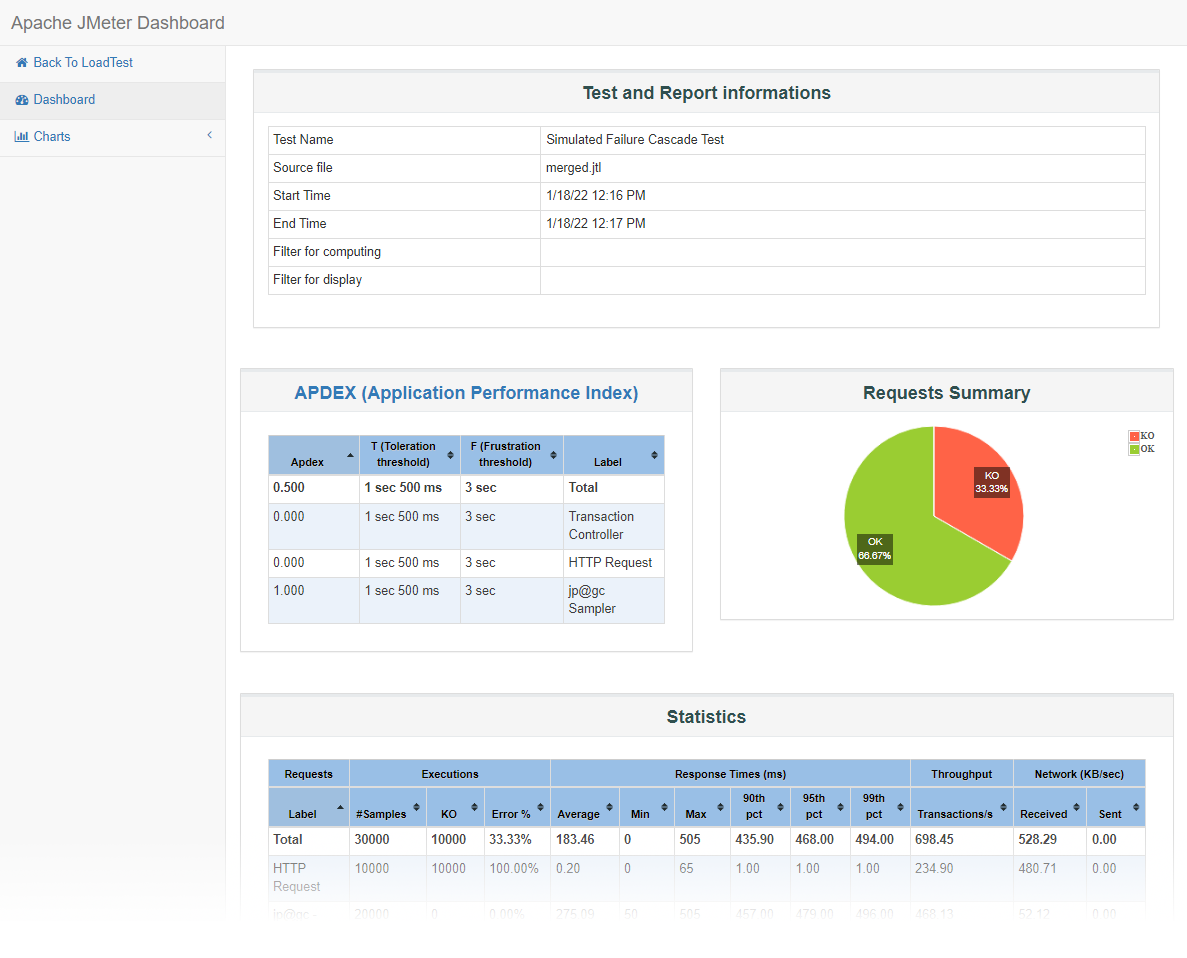
You can quickly access the JMeter Dashboard Report under the “Output Files” heading after your test concludes. Simply click on the “View” button to open the report within your browser:
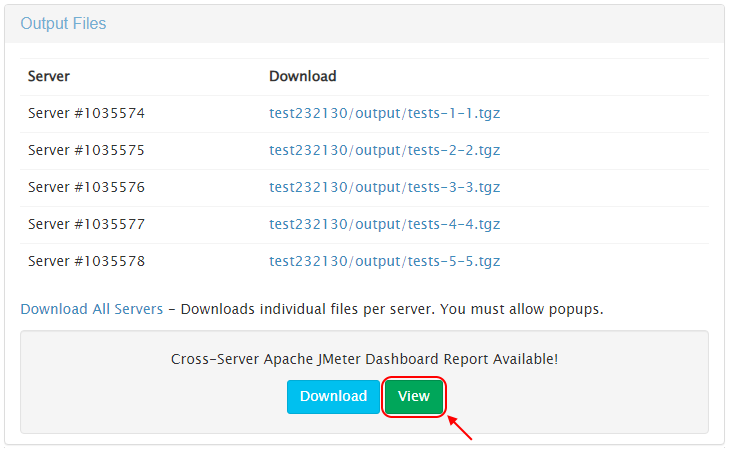
While we do offer the ability to download this report as a compressed archive, the “View” feature makes displaying this useful report much easier. It is especially convenient when running multiple tests or performing multiple comparisons. (Being mindful of the Summary table Total row, of course.)
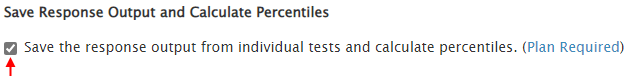
In order to for us to support the JMeter Dashboard Report, you will need to configure those tests to generate Output Files. This can be done when starting your load test and ticking the “Save Response Output and Calculate Percentiles” option:
Did you know that RedLine13 offers a free trial that includes this and all of our Premium features? Sign up now and view the JMeter Dashboard Report for yourself today!