
The JMeter Dashboard Report can be displayed from any RedLine13 test which has output files enabled. One question we frequently get from customers using JMeter is how the JMeter Dashboard Report Total row is calculated. Found within the Summary table for this report, the Total row is displayed in a non-intuitive way. Without knowledge of what this line represents, the design of the report with regard to the Total row can be confusing. Depending on what information you need, we can suggest some alternatives.
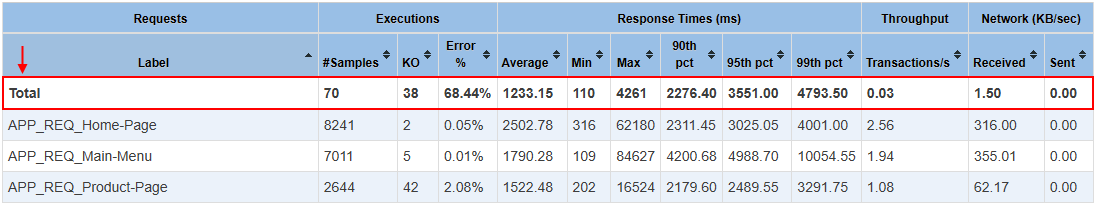
In short these are totals containing the sum of metrics for each request type based on a weighted average calculation that is not immediately apparent. They are in fact weighted by request count but then summed together without regard to this weight. It is a design decision on the JMeter Dashboard report that unfortunately offers little utility. In most cases, the Total row can be ignored in the dashboard report. There are other many other use cases for this report. The more useful weighted average is calculated and displayed on the RedLine13 results page, and composed of the percentile response time for each request weighed against the number of samples for that request.
Did you know that RedLine13 offers a full-featured free trial? Sign up now and start load testing on our platform today!