We are happy to call this our Valentine’s release, all features are driven by user requests. As always feedback and new ideas welcome.
- Simple Test Plan now has RampUp time.
- Team Filtering
- Detailed Percentiles for pages
- Summary View
- Requests Table
- Requests Table Filter
- Kill Servers for Managed Servers with Policy Validation
- Averaging Graphs
- Aligning Graphs timestamp
- AutoIncrement Test Name
- Overview Requests/Threads includes Error Data
- Request Metrics with KB per request and Averages
- Error Graphs by URL: Error Rate, Error Avg Response Time, Error Download size
Details on each feature update below.
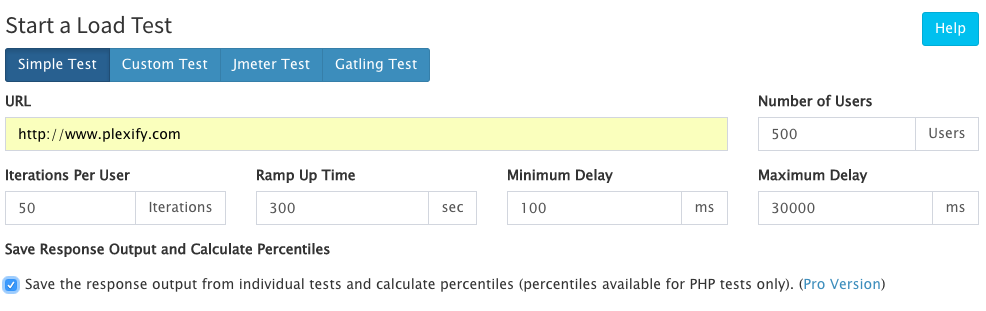
Simple Test Plan now has RampUp Time
- Ramp Up Time – It evenly distributes the start time of each test over the interval. After that delay, it starts the test, at which point another delay will be introduced based on the min/max delay setting before loading the first URL.
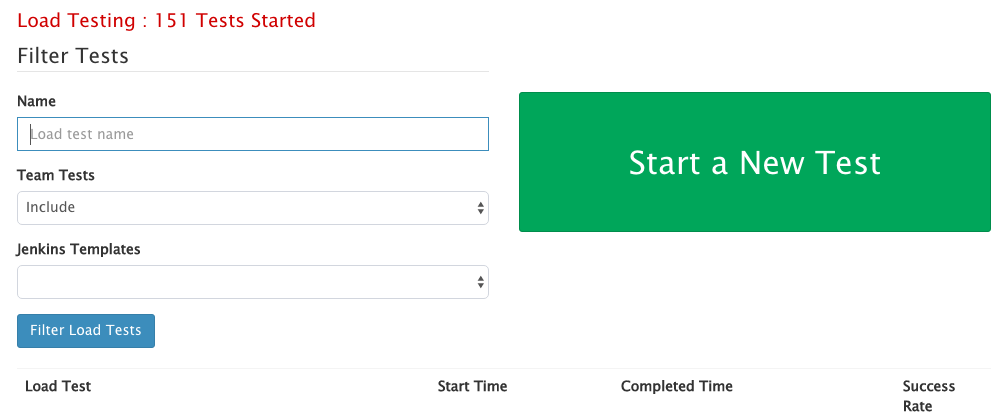
Team Filtering [Subscription]
- For team accounts, you can include and filter tests from your team members
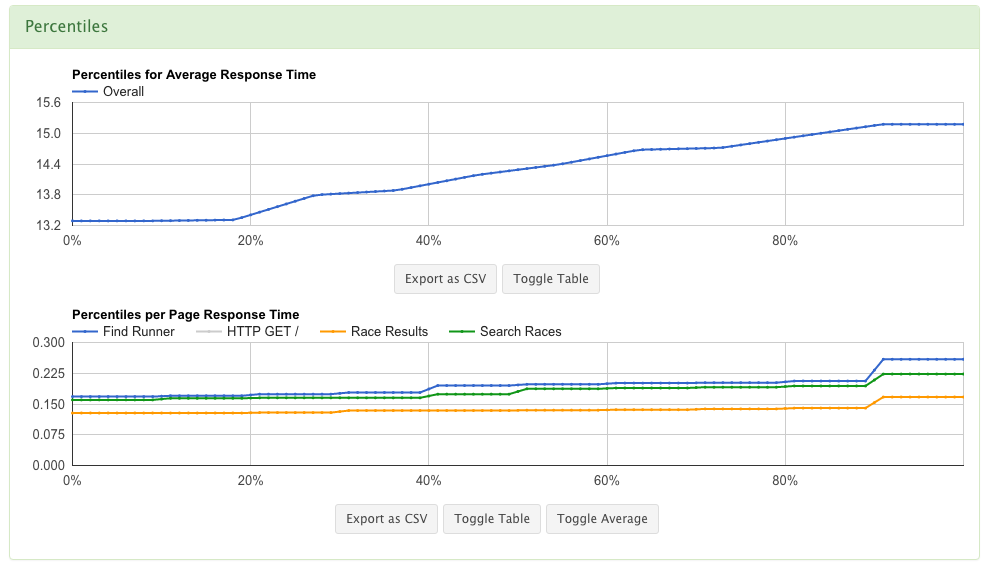
Detailed Percentiles for pages [Subscription]
- Percentiles are available for the overview metric, JMeter Thread, or Gatling User.
- We now have percentiles for each requested page in JMeter tests
- Average calculation across requests pages
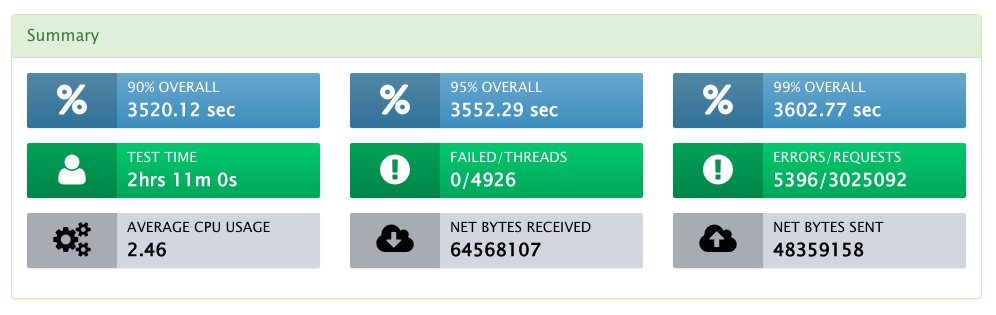
Summary View
- On test completion an overview of response, errors, test time, and agent metrics
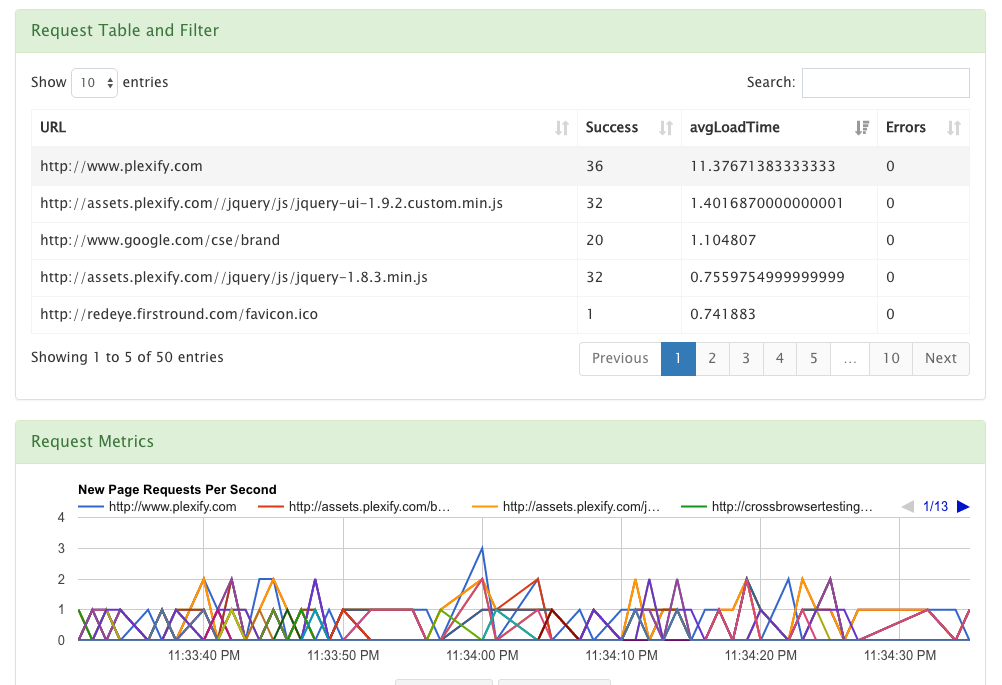
Requests Table
- A table view of your requests with search and sort.
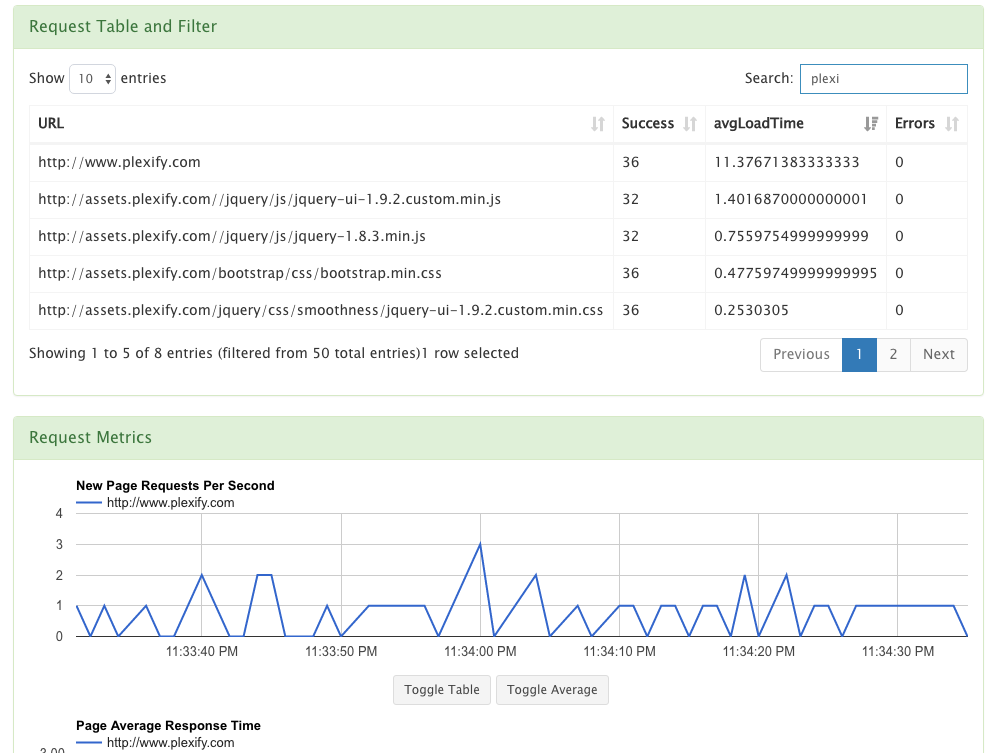
Requests Table Filter
- The requests table can also filter all the graphs that follow based on the request selected
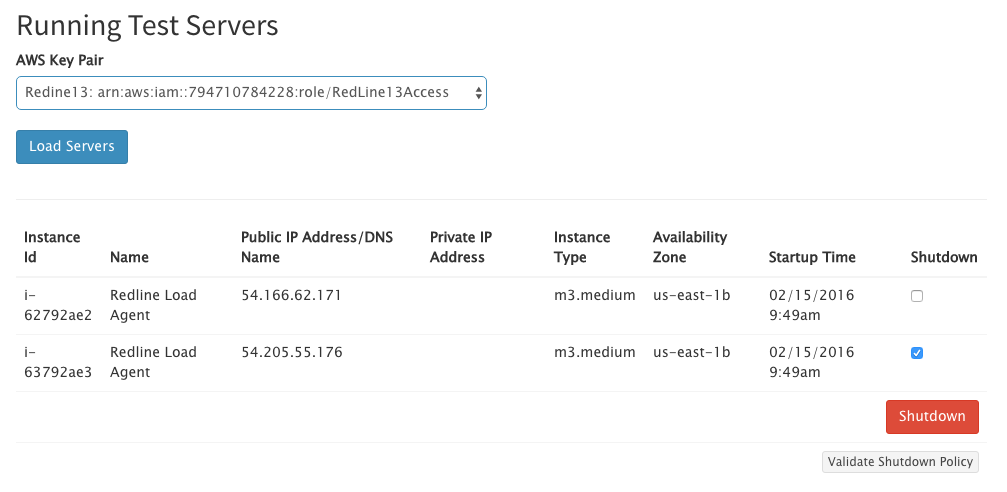
Kill Servers for Managed Servers with Policy Validation
- With a policy update, you can now use RedLine13 to kill your agents remotely.
- Useful if you want to immediately terminate instances or have rogue agents not responding.
- Click the ‘Validate Policy’ to see if your AWS cross-account is setup properly.
Averaging Graphs
- Graphs with multiple data points support Sum, Max, Average which will be computed on the displayed data
- Supported for Page Percentiles, Request Metrics, Error Metrics, System Metrics
- In average mode the table will show the Average, Max, Sum.
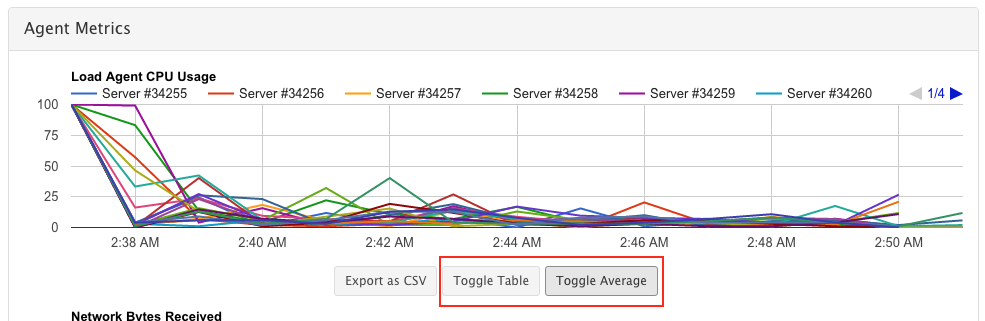 After selecting ‘Toggle Average’ and ‘Toggle Table.’
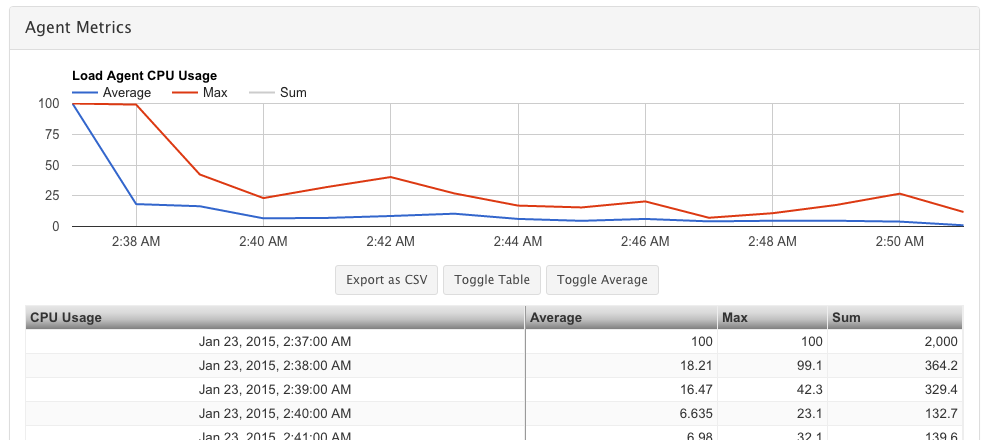
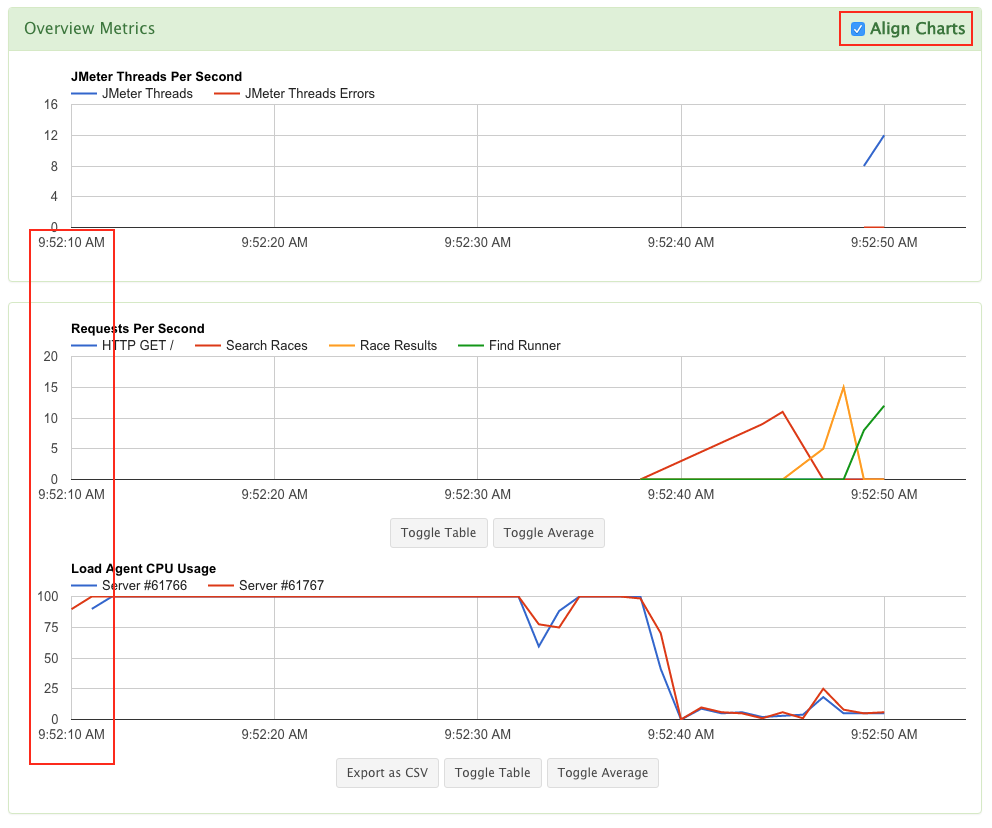
Aligning Graphs timestamp
- The time series data for agents, requests, and overview have different start and stop times based on when metrics are received. Align Charts will allow you to switch the graphs to all align to the same start and stop times.
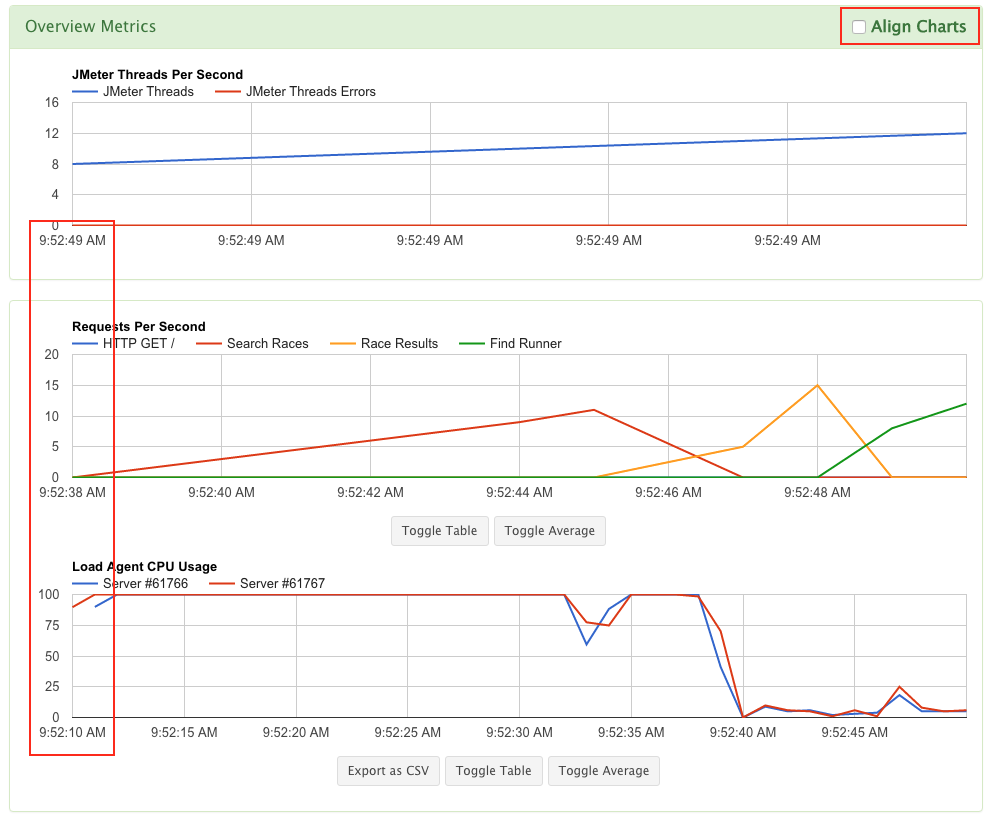
- After selecting Align Charts, you will see the same start and stop timestamps
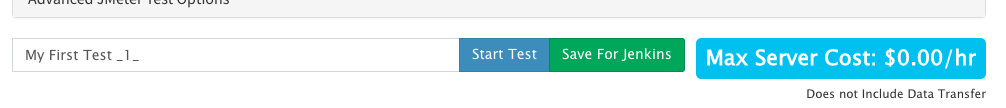
AutoIncrement Test Name
- User request; we keep the test name during clone tests and auto increment a trailing number.
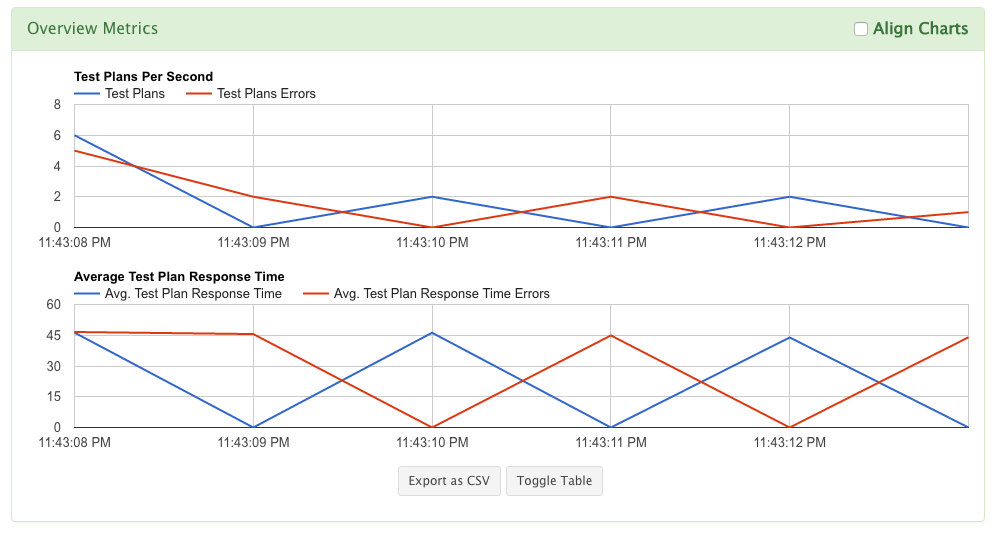
Overview Requests/Threads includes Error Data
- Overview metrics previously now includes error requests and performance
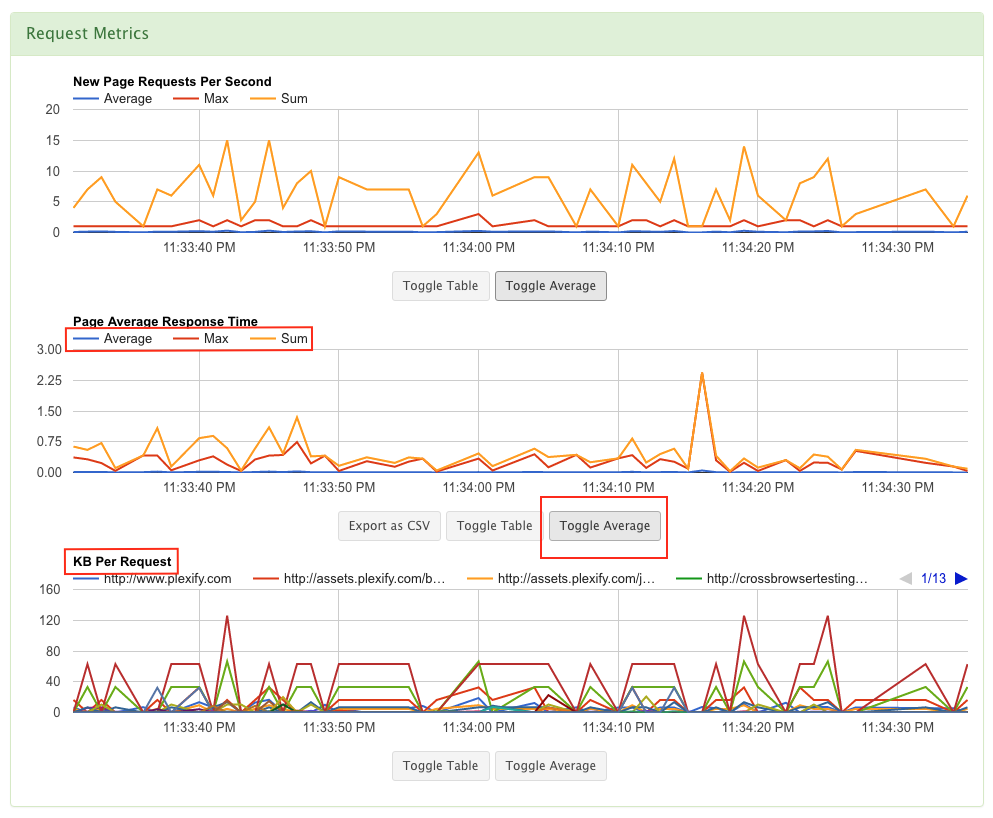
Request Metrics with KB per request and Averages
- Request metrics updated to include download data on a per request basis
- Graphs now have ‘Average’ to get Max, Sum, Average data displayed.
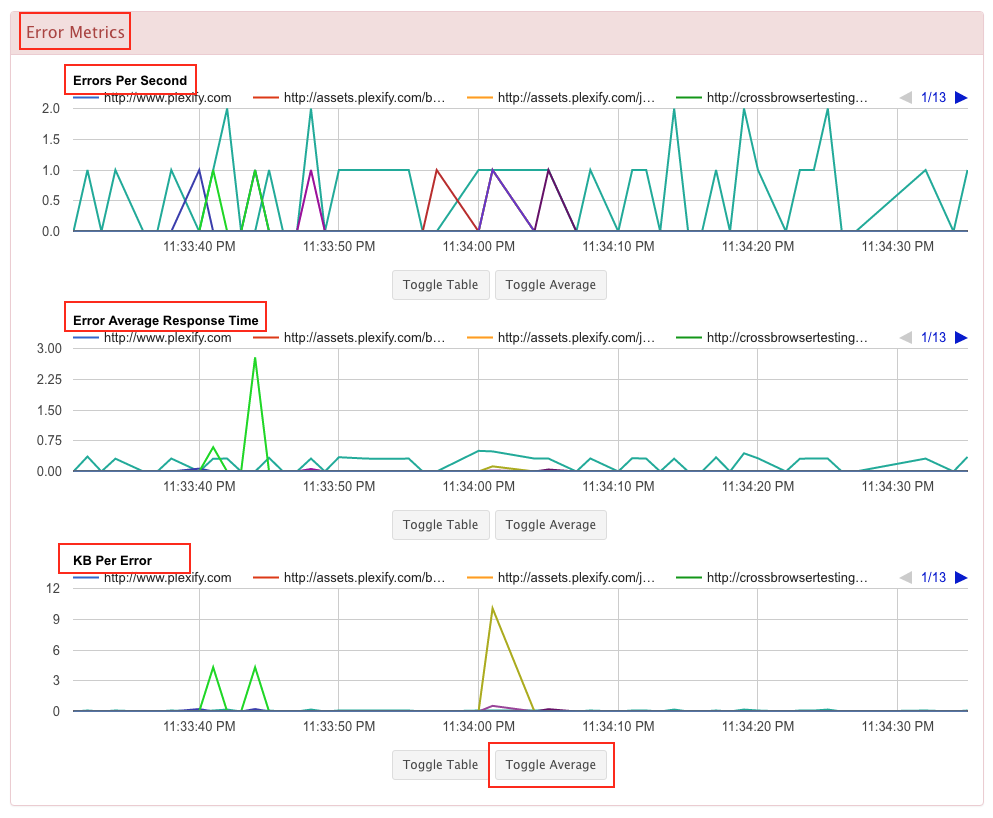
Error Graphs by URL: Error Rate, Error Avg Response Time, Error Download size
- We know have detailed metrics for requests that end up as an error.
- Errors Per Second, Error average response time, KB per Error
- Graphs support Average, Max, Sum
Happy Valentine’s Day!