 While RedLine offers the most scalable and lowest cost mechanism to test your web or mobile application, how do you really know what is happening in your application and your environment?
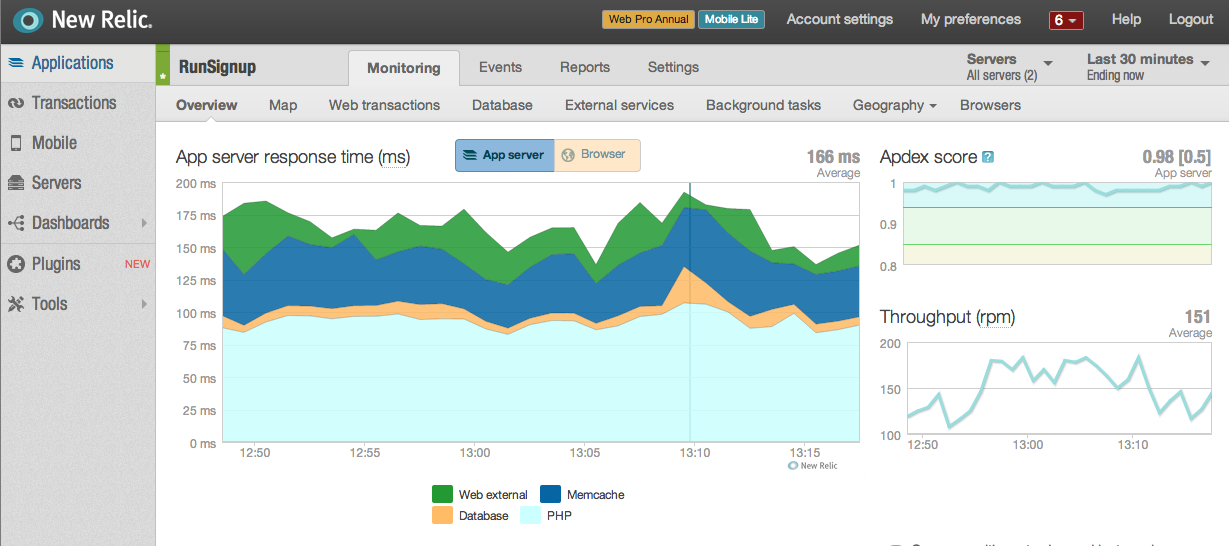
New Relic has emerged as the leading tool for monitoring and understanding your application and deployment environment. As the diagram at the right shows, New Relic enables developers and operations experts to drill down in their servers and applications. You can see into your different tiers like the database, application, web server and network tiers.
RedLine makes it possible to test at any scale by deploying spot instances on Amazon. This is so cost effective, you can emulate 50,000 users on 200 m1.small spot instances for about $2.00 per hour for example.
Getting Started
To get started, you will need an account on both New Relic and RedLine. Simply go to:
- New Relic and click on “Create Free Account”.
- RedLine Load Testing and fill in the SignUp form.
After configuring New Relic on your servers running the application, you will start to immediately see stats like the screen shot above. You can then use RedLine to create a test load according to the options outlined here.