In this video we will demonstrate how to run a simple URL test to gauge performance of a website. If you’re new to load testing, this is the easiest test to run on RedLine13.
Getting Started
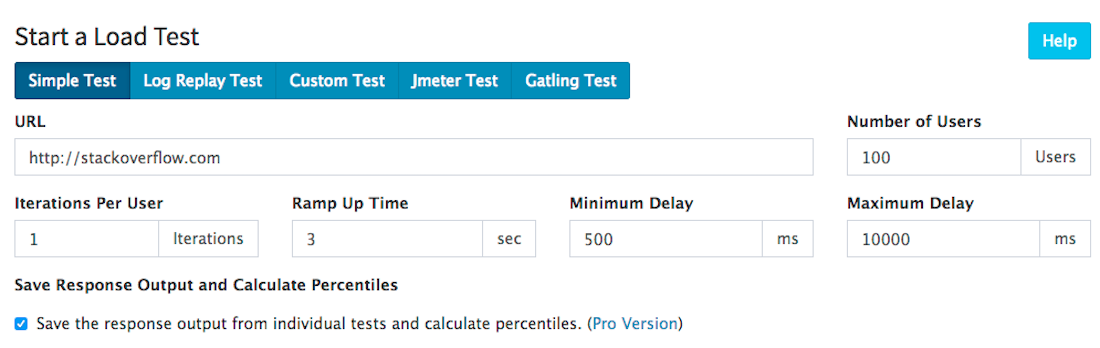
When running a URL test on RedLine13, begin by logging into your account, hit “Start Test”, and then click the “Simple Test” tab. Next, begin to enter the parameters of your load test. In this example we will have 100 virtual users access StackOverflow. We have a 3 second ramp-up-time, a minimum delay of 500 ms, and a maximum delay of 10,000 ms:
Configure Servers and Run Test
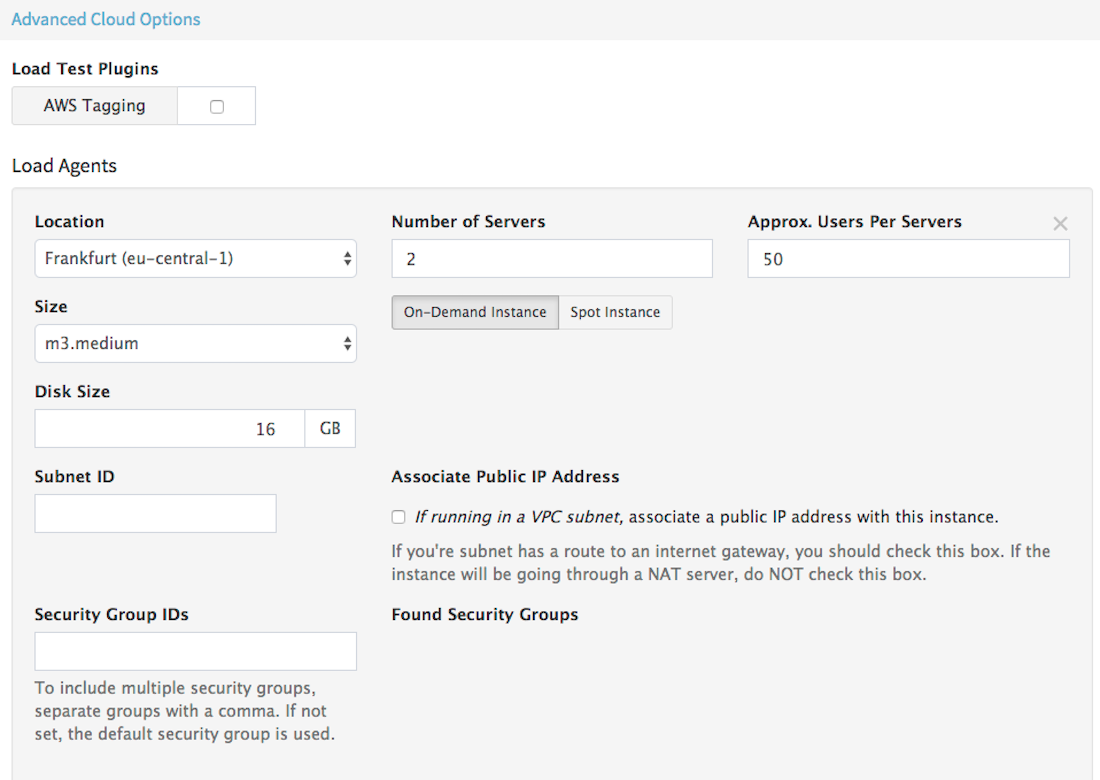
Next, expand the “Advanced Cloud Options” tab. Here you control your load agents. You can select the type/size/number/location of the servers, edit security groups, and more. In this example we will be testing on two m3.medium servers in Germany, with 50 users per server:
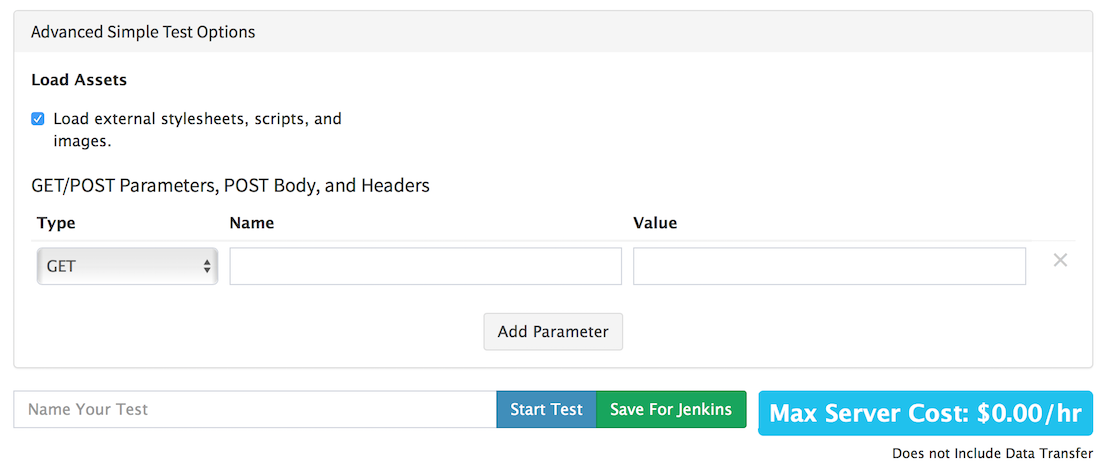
If needed, we can expand the “Advanced Simple Test Options” to add and GET/POST parameters. Finally, name your test and hit “Start Test” to begin. The servers will spin up and your test will begin shorty.
Analyze Results
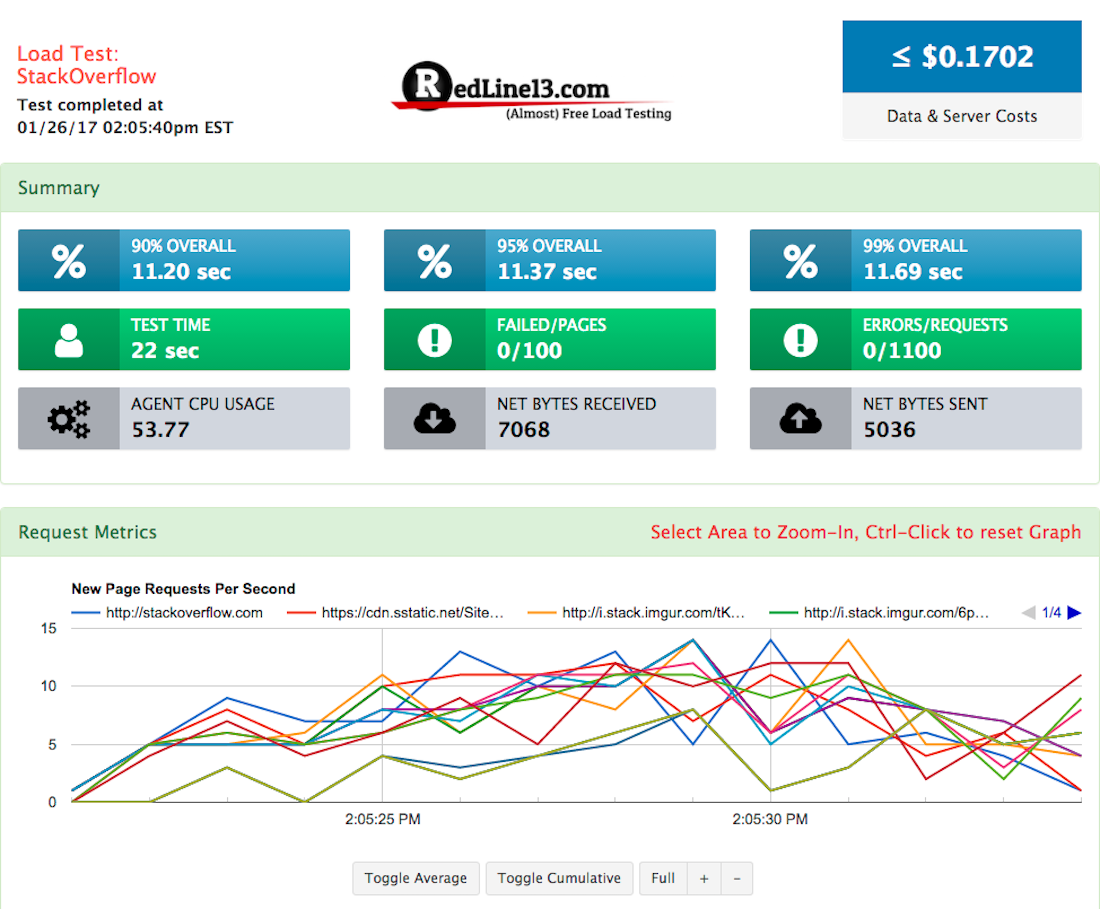
Once the test has completed we can then view our results. Here we are presented with an overview and breakdown of everything that happened during the test. You will find:
- Response/request metrics
- Percentile results (Pro)
- Overview metrics (threads per second, average thread elapsed time, etc.)
- Error metrics (error response time, errors per second, etc.)
- Load agent metrics (load agent CPU usage, bytes received/transmitted, etc.)
- Server output files (.tgz)
- + more
In this example we found that out of the 1,100 requests made, 99% were completed in 11.69 seconds. Some 100 pages were tested and our load test costed us only $0.17 cents in total, making it an affordable solution to test URLs.