Eldad Uzman, Automation Architect at Merck, is the guest author. You can read more from Eldad at Medium.
Abstract
In this article, I’ll present to you a case study of how you can integrate Locust into your Redline13 JMeter tests to get the maximum out of your testing environment, increase your load testing coverage while reducing the usage of infrastructure and thus reducing the costs.
JMeter in a nutshell
JMeter is a java-based load testing tool and one of the most long-standing tools on the market.
For the sake of this article, it’s main characteristic is it’s thread-based architecture, which means that for each virtual user (VU) JMeter will spawn a new thread in the operating system and each thread will perform the tasks related to the test flow of each virtual user.
For the most part, JMeter flows are scripted via its GUI, but it also allows some coding, namely by using groovy language.
Locust in a nutshell
Locust is a python-based load testing tool, and it is relatively new on the market.
Unlike JMeter, locust is powered by asynchronous io, which means that all virtual users run on a single thread, and concurrency is achieved not by spawning new threads in the operating system but rather by switching between IO contexts using a greenlet.
Hands on with locust
Since JMeter is already heavily covered in RedLine13 blog posts, in this section I’ll provide a short introduction to the various options available in locust.
Prerequisites
First, lets make sure we have python installed on our pc:
root@eldaduzman-lap:~# python  --version
Python 3.10.4
root@eldaduzman-lap:~#Next, we can install locust using pip
root@eldaduzman-lap:~# pip install locustSimple example
from itertools import count
from locust import HttpUser, between, task
USER_NUMBERS = count(1)

class WebsiteUser(HttpUser):
	wait_time = between(10, 12)
	host = "https://postman-echo.com"

	def __init__(self, *args, **kwargs):
		self._user_number = next(USER_NUMBERS)
		super().__init__(*args, **kwargs)

	@task
	def index(self):
		response = self.client.get(f"/get?var={self._user_number}", name="get_usr_num")
		var = response.json()['args']['var']
		response = self.client.get(f"/get?var={var}", name="get_var")
In this example, each virtual user is initiated with a unique sequence number (similar to the __threadNum variable in JMeter) and then it executes its task every 10-12 seconds
The task is to send a one get request with the sequence number, extract the number from the response, and then to send it as a different request.
To execute the locust test script, we can run the following command:
root@eldaduzman-lap:~# locust -f locustfile.pyThis will create a web interface that you can open in your browser at `http://localhost:8089/’
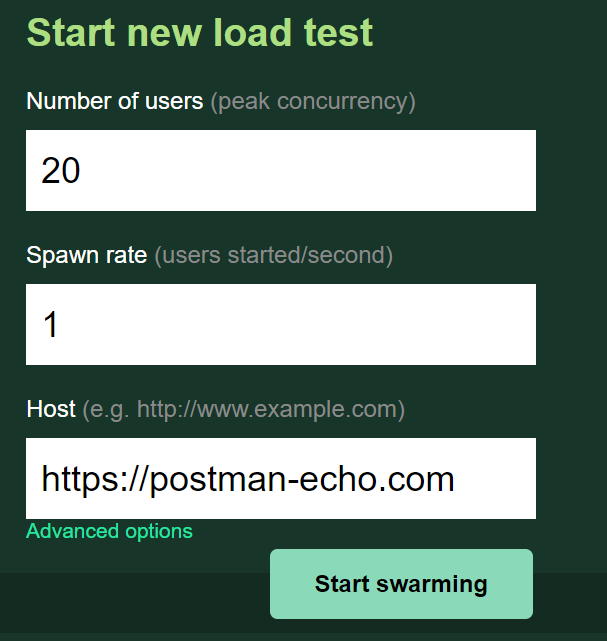
We will spawn 20 virtual user and leave them to run for a while
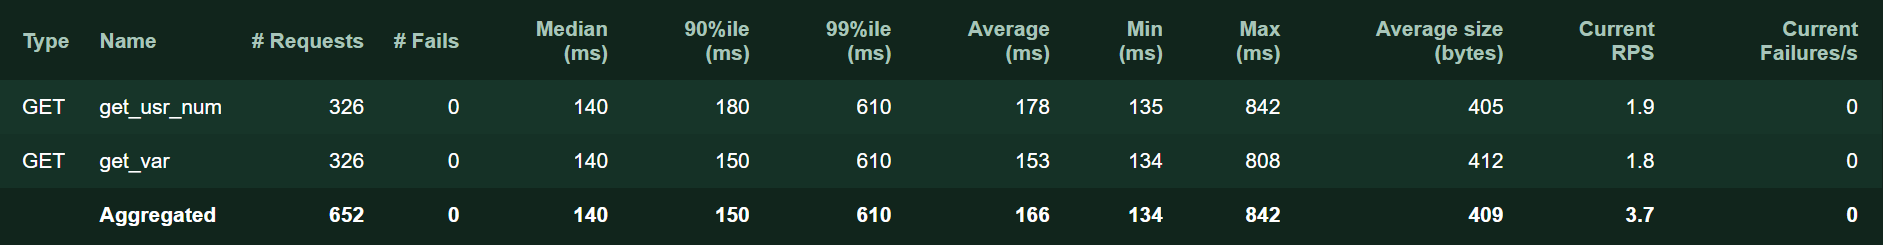
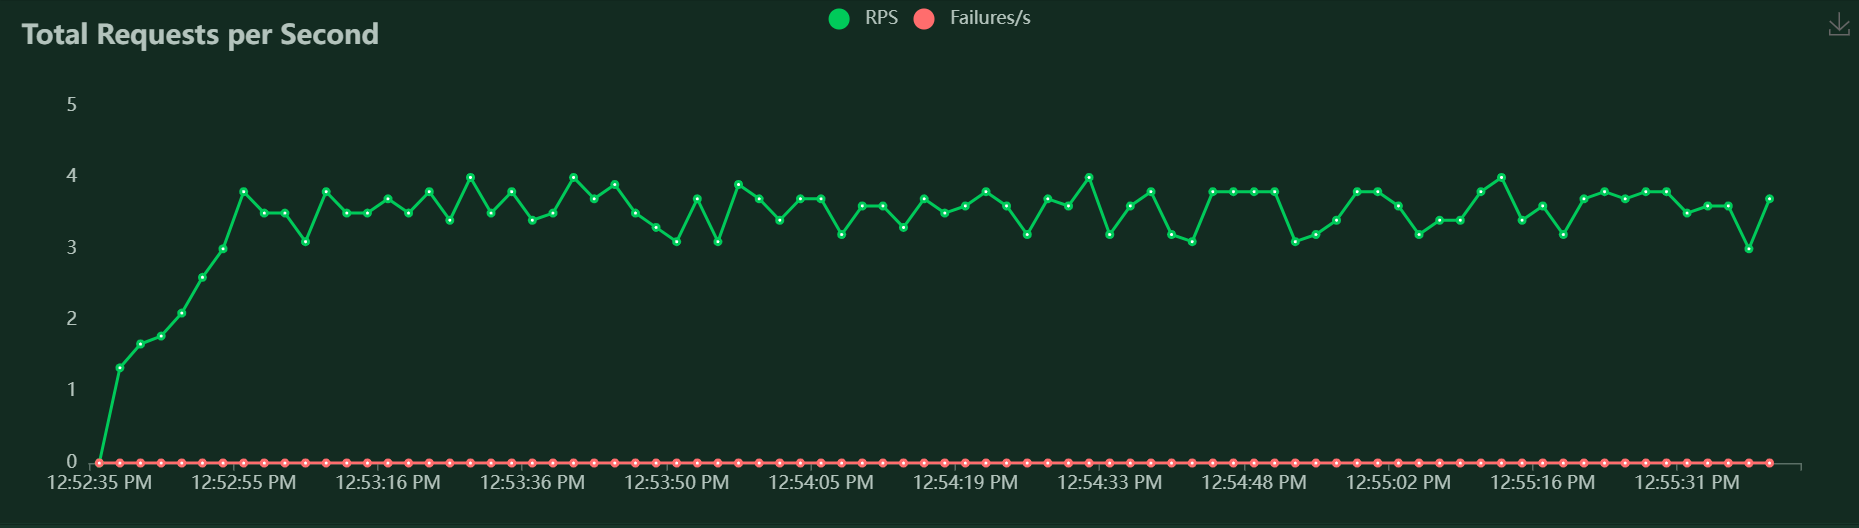
Now with the test completed, we see that the average request per second was 3.7, which makes sense, as each user would send 2 requests every ~11 seconds.
Which means that 10.9 requests per minute will be sent from each user.
If we multiply that by 20, the total request per minute count should be 218.18, which would make ~3.63 request per second.
A more complex example
Let’s try a different scenario, instead of sending http requests, lets send a message to AWS SQS queue
Lets install first boto3 from pip:
root@eldaduzman-lap:~# pip install boto3 import os
import time
import sys
import json
from itertools import count
from locust import User, between, task
import boto3
from boto3.exceptions import Boto3Error
REGION = os.environ.get("REGION")
ACCESS_KEY = os.environ.get("ACCESS_KEY")
SECRET_KEY = os.environ.get("SECRET_KEY")
QUEUE_NAME = os.environ.get("QUEUE_NAME")
assert (
REGION and ACCESS_KEY and SECRET_KEY and QUEUE_NAME
), "One or more of the following environment variables is missing [REGION | ACCESS_KEY | SECRET_KEY | QUEUE_NAME]"
USER_NUMBERS = count(1)
def get_queue():
"""get boto3 sqs queue object"""
return boto3.resource(
"sqs",
region_name=REGION,
aws_access_key_id=ACCESS_KEY,
aws_secret_access_key=SECRET_KEY,
).get_queue_by_name(QueueName=QUEUE_NAME)
class SQSUser(User):
wait_time = between(120, 130)
host = "https://postman-echo.com"
def __init__(self, *args, **kwargs):
self._user_number = next(USER_NUMBERS)
self._queue = get_queue()
super().__init__(*args, **kwargs)
@task
def send_sqs_message(self):
"""sends a message to SQS"""
time_start = time.time() * 1000
try:
aws_response = self._queue.send_message(
MessageBody=json.dumps({"user_id": self._user_number})
)
time_end = time.time() * 1000
self.environment.events.request_success.fire(
request_type="SQS",
name="queue",
response_time=(time_end - time_start),
response_length=sys.getsizeof(aws_response),
)
except Boto3Error as ex:
time_end = time.time() * 1000
self.environment.events.request_failure.fire(
request_type="SQS",
name="queue",
response_time=(time_end - time_start),
exception=ex,
response_length=0,
)In this example, the script assumes that the details for the SQS queue are stored in the environment variables.
Then it will use the details to generate connections to the sqs, and it will send messages every 120-130 seconds.
Now we can run this script with 50 users
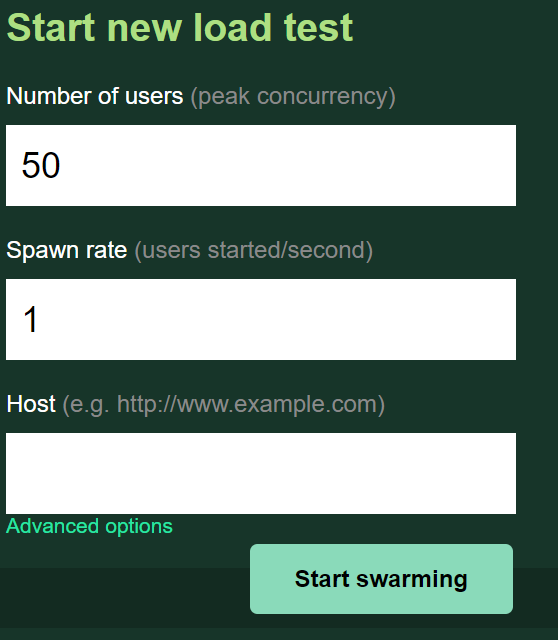
And the results would be as follow:

Locust as library
In the examples above, we would be required to execute locust manually, now let’s run it as a python script
Let’s install another dependency, click, for parsing command line arguments.
root@eldaduzman-lap:~# pip install clickimport os
import click
import gevent
from locustfile_sqs import SQSUser
from locust.env import Environment
from locust.html import get_html_report
from locust.env import Environment
from locust.stats import stats_printer, stats_history
@click.option(
"--number-of-users",
help="how many locust users to simulate",
type=click.INT,
required=True,
)
@click.option(
"--duration-in-seconds",
help="Duration of execution - if not provided, execution will run infinitely",
type=click.INT,
default=-1,
required=False,
)
@click.option(
"--output-path",
help="path to output report",
type=click.STRING,
default="report.html",
required=False,
)
def main(
number_of_users,
duration_in_seconds,
output_path: str = "report.html",
):
env = Environment(user_classes=[SQSUser])
env.create_local_runner()
assert env.runner, "must have a runner"
try:
gevent.spawn(stats_printer(env.stats))
gevent.spawn(stats_history, env.runner)
env.runner.start(number_of_users, spawn_rate=1)
if duration_in_seconds > -1:
gevent.spawn_later(duration_in_seconds, env.runner.quit)
env.runner.greenlet.join()
except KeyboardInterrupt:
pass
finally:
dir_path = os.path.dirname(os.path.abspath(output_path))
if not os.path.exists(dir_path):
os.makedirs(dir_path)
with open(output_path, "w", encoding="utf-8") as html_file:
html_file.write(get_html_report(environment=env))
dispatch = click.command()(main) # make pylint happy
if __name__ == "__main__":
dispatch()In this script, we use click to collect 3 command line argument:
- number-of-users
- duration-in-seconds
- output-path
Then we take the SQSUser class we’ve created earlier and run it programmatically without the GUI.
At the end of the script, it will save the html report in the given path
To run this code, the command line can look something like this:
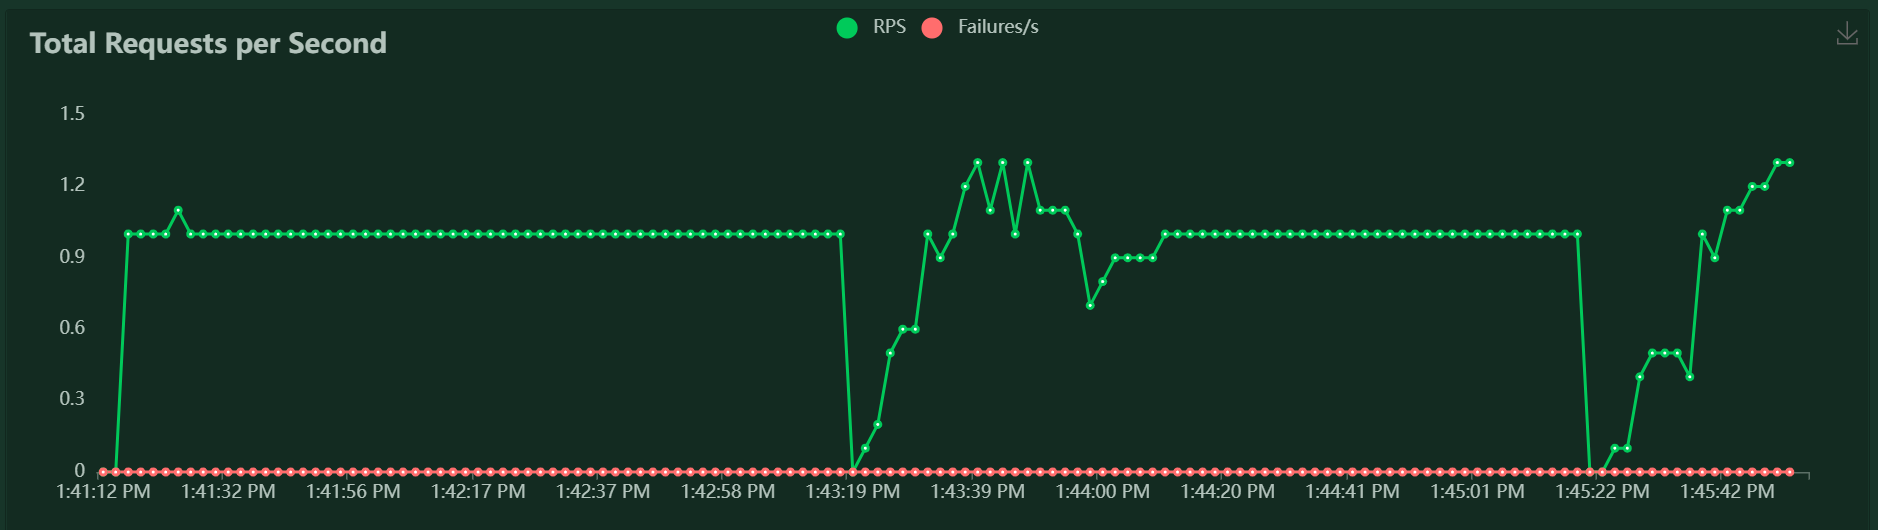
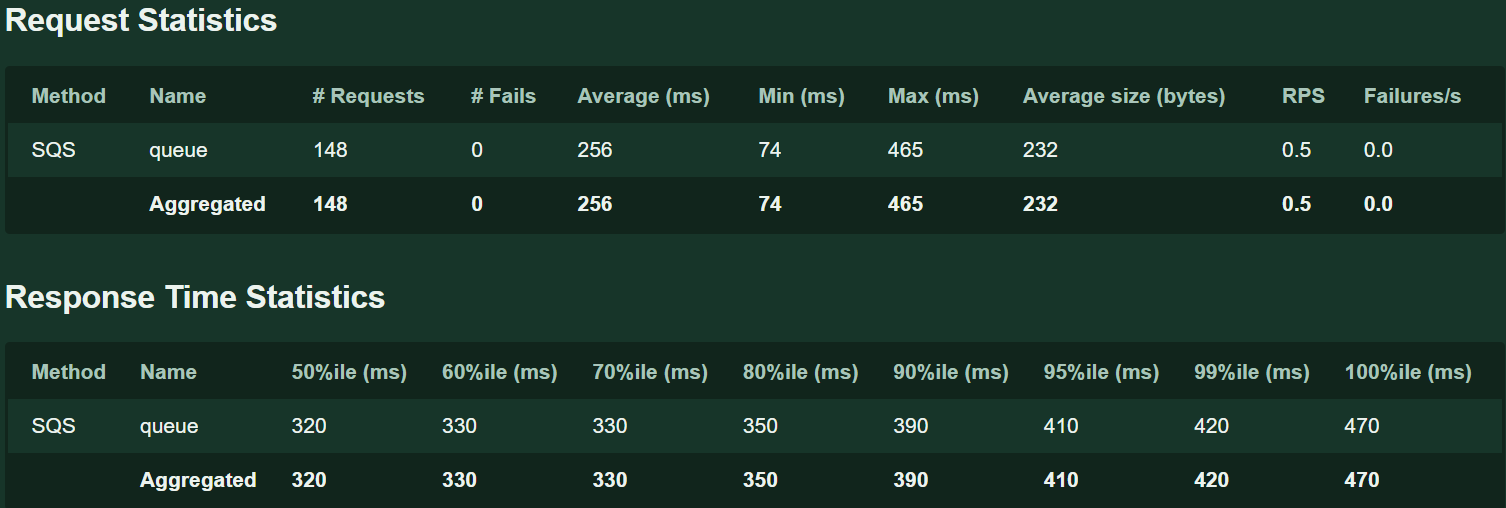
root@eldaduzman-lap:~# python main.py --number-of-users 50--duration-in-seconds 300 So we spawned up 50 SQS users for 300 seconds.
The results is:
Locust as executable
So far, we’ve created a python script that runs locust programmatically.
However, to use the script, we need the target machine to have python installed and it must have all the prerequisites packages installed as well.
This might be a bit difficult to manage.
Ideally, we would like to have a self-contained executable which can be simply executed directly, and luckily this is possible by using pyinstaller!
Pyinstaller creates a self-contained file that wraps your python code with the python interpreter, libraries and other resources for you to execute in other machines of equal configuration.
This is made possible thanks to the new RedLine13 version which runs ubuntu version 22.04.
So lets first install pyinstaller using pip
root@eldaduzman-lap:~# pip install pyinstaller Now, we can wrap the main file as an executable with the following command:
root@eldaduzman-lap:~# pyinstaller --onefile main.py --add-data
venv/lib/python3.10/site-packages/locust/static:locust/static --add-data
venv/lib/python3.10/site-packages/locust/templates/:locust/templates
This creates the self-contained file with locust static files and templates.
The file is in the `dist` directory under the name `main`.
Now we can run this file directly:
root@eldaduzman-lap:~#./main --number-of-users 50 --duration-in-seconds 300 Connecting all the dots
We’ve created a self-contined executable file, now we can take this file and run it from with in the context of JMeter 😊
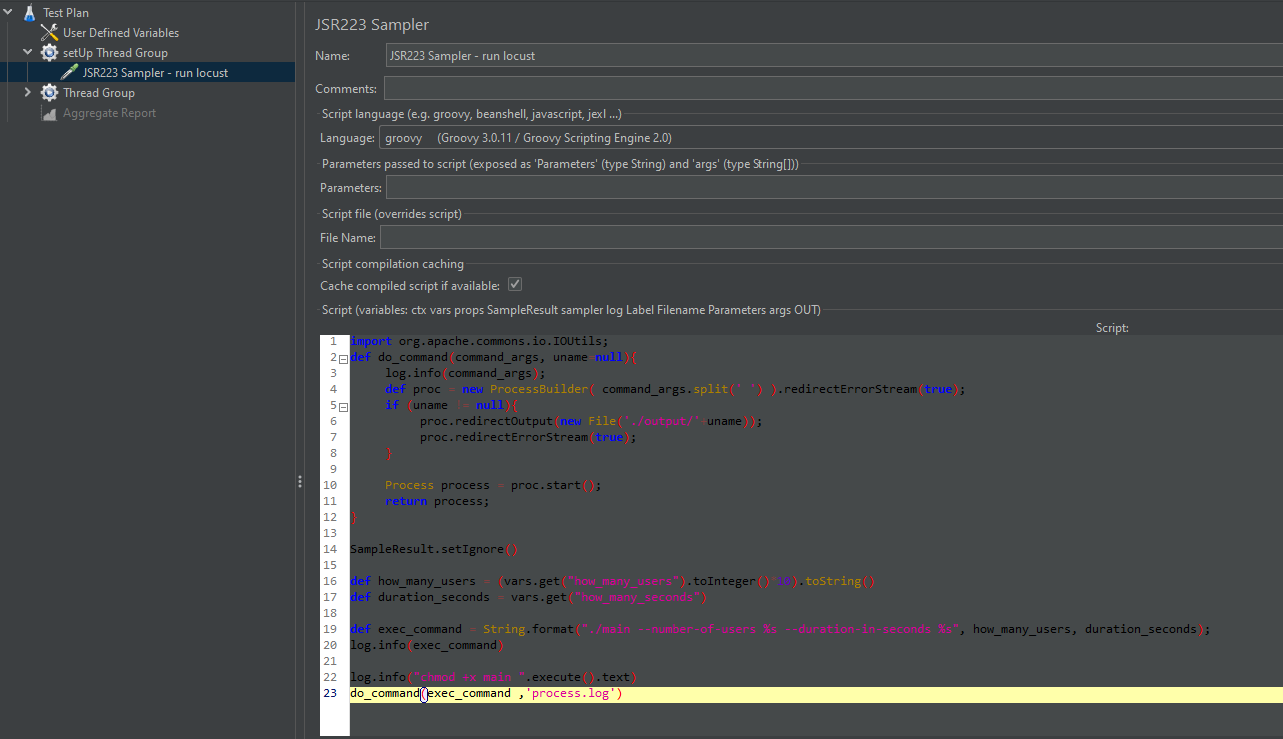
Let’s take a look at the groovy code:
import org.apache.commons.io.IOUtils;
def do_command(command_args, uname=null){
    log.info(command_args);
    def proc = new ProcessBuilder( command_args.split(' ')
).redirectErrorStream(true);
    if (uname != null){
        proc.redirectOutput(new File('./output/'+uname));
        proc.redirectErrorStream(true);
    }
    Process process = proc.start();
    return process;
}
SampleResult.setIgnore()
def how_many_users = (vars.get("how_many_users").toInteger()*10).toString()
def duration_seconds = vars.get("how_many_seconds")
def exec_command = String.format("./main --number-of-users %s --duration-in-seconds
%s", how_many_users, duration_seconds);
log.info(exec_command)
log.info("chmod +x main ".execute().text)
do_command(exec_command ,'process.log')
In this script, we execute `main` with the inputs from the user defined variables:
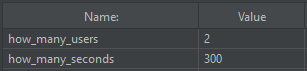
For each JMeter user, locust will run 10 users and then the report will be restored in RedLine13’s output directory.
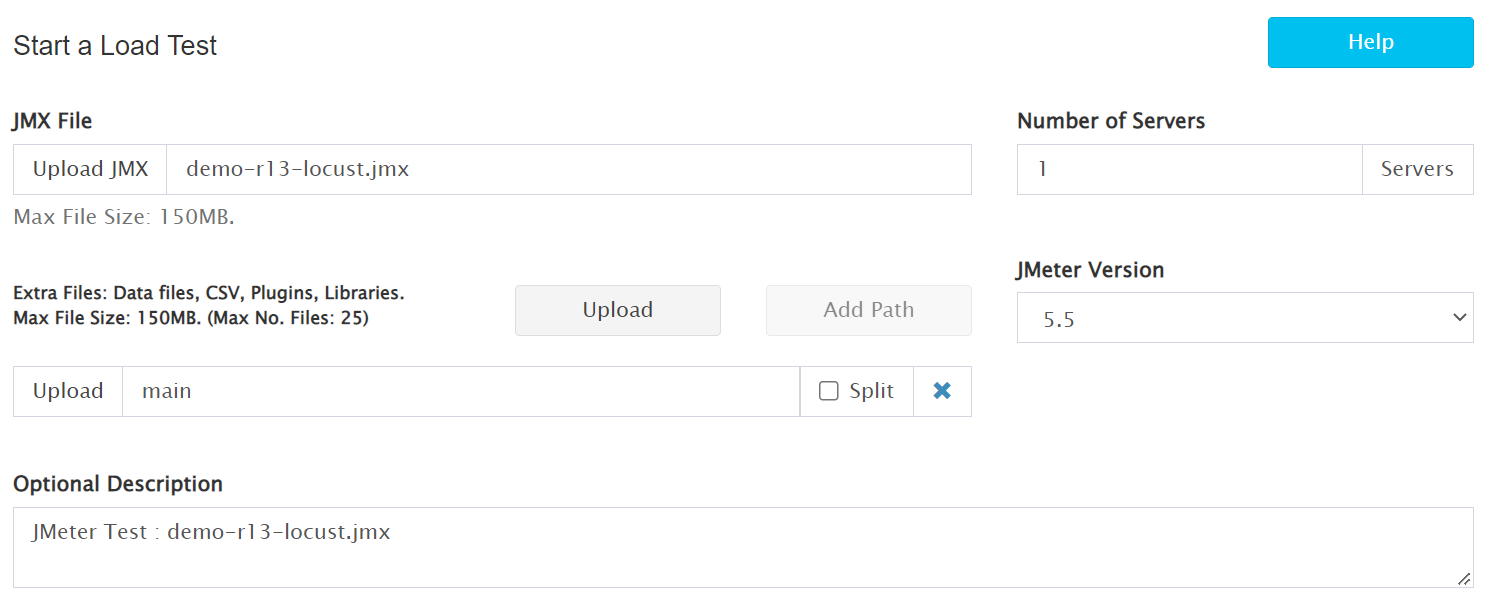
Load Testing with Locust and JMeter on RedLine13
Now lets run this from RedLine13:
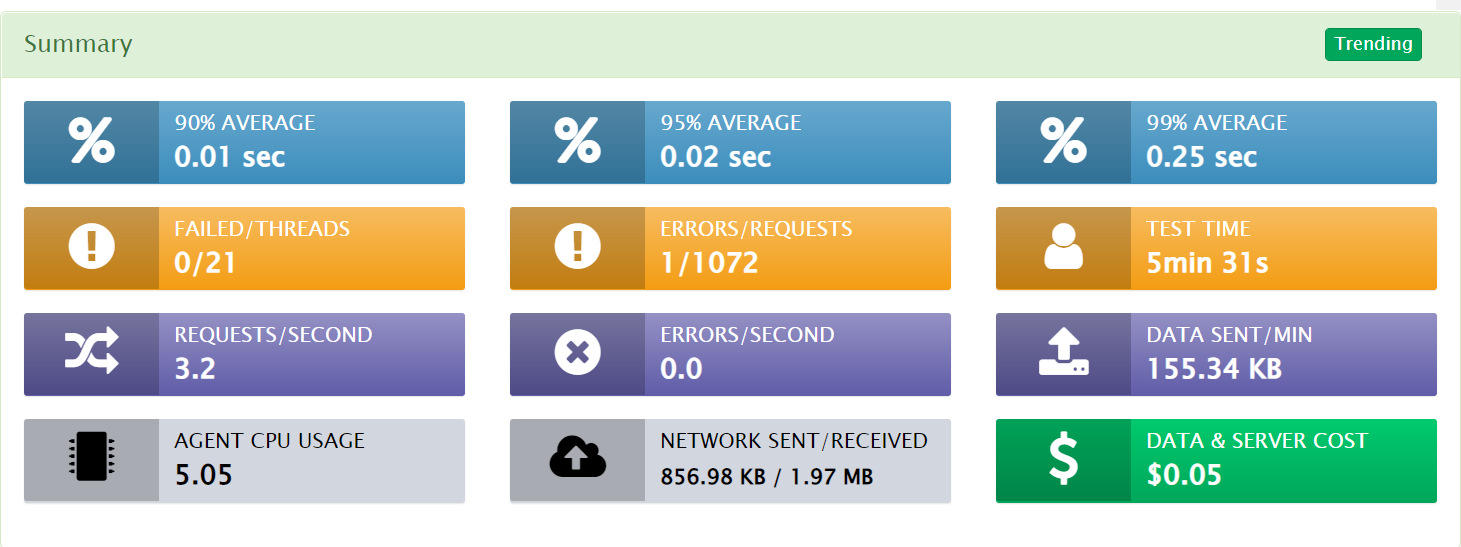
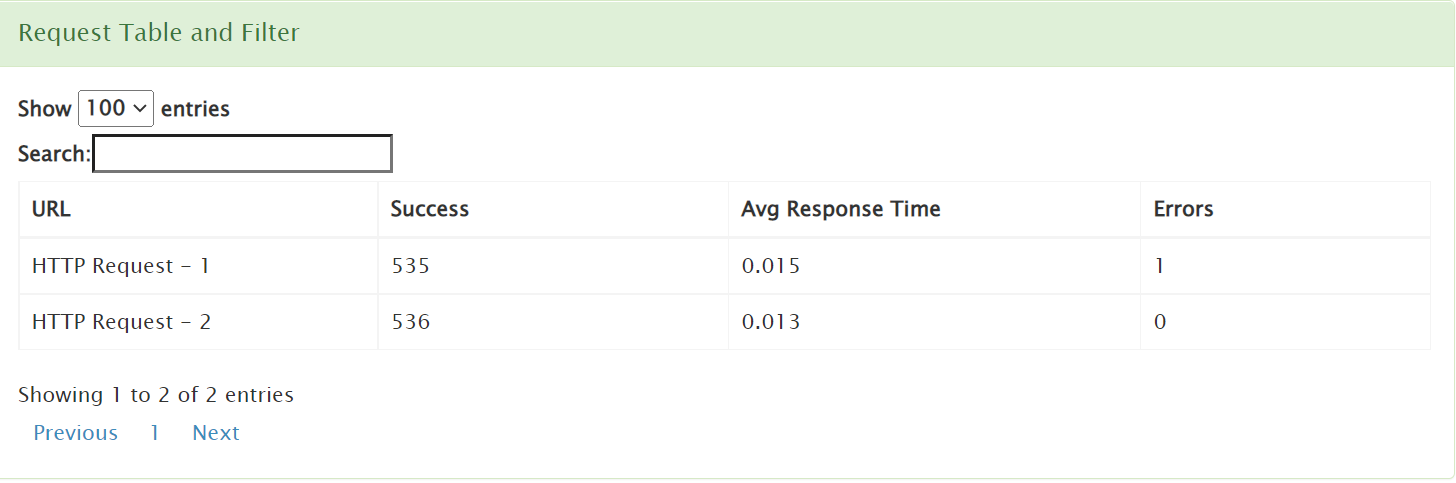
After the test is completed, lets look at the results:
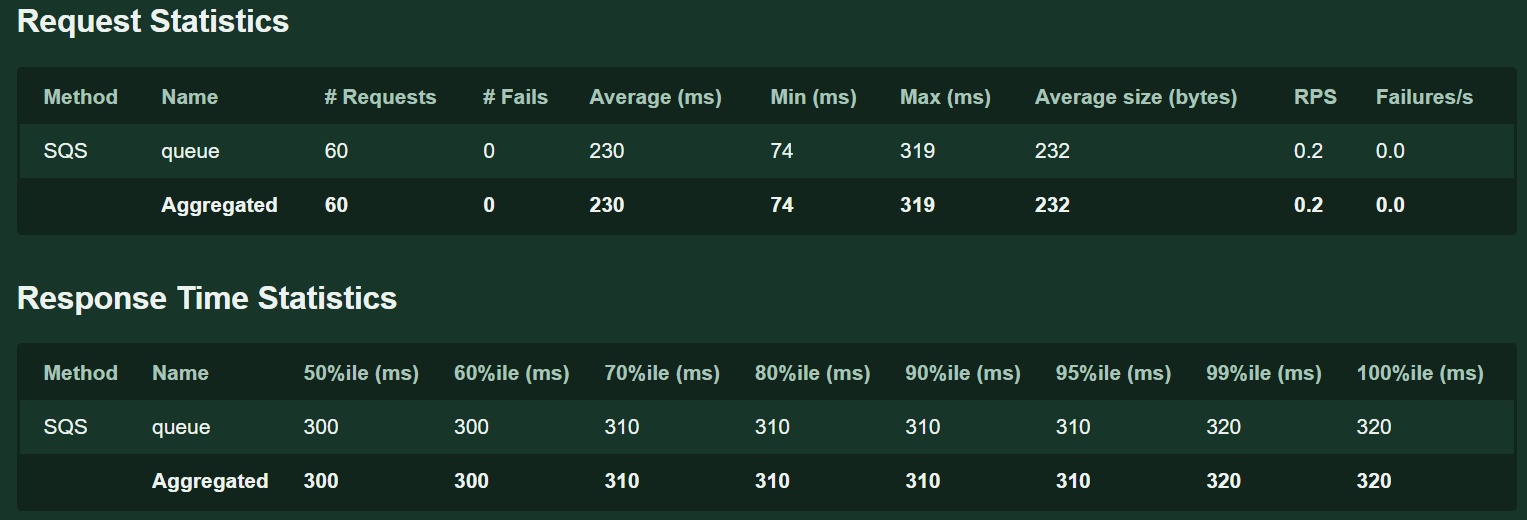
And we can also go into the output file and see the locust html report:
Why?
So, after the demo is completed, now we can go back to the question – why on earth would we go through all this trouble?
The different architectural style, thread-based vs asyncio-based, make these two tools excel in different domains.
For the most part, it seems that locust is better at large number of virtual users with low traffic, and JMeter is better at generating high traffic from a smaller number of users.
There could be some exceptions to the rule, but if you find yourself in a situation where you need to combine the two, it might be helpful for you to use this solution and reduce the costs of your load testing efforts.
Likewise, some test flows are easier to implement in locust, owing to the massively rich python eco-system.
On a final note
This case study illustrates RedLine13’s remarkable flexibility.
In a sense, RedLine13 provides not only with a test execution environment but you also get an experiment environment to explore different possibilities.
External links
Try RedLine13
You can sign up and try RedLine13 today for any load testing.