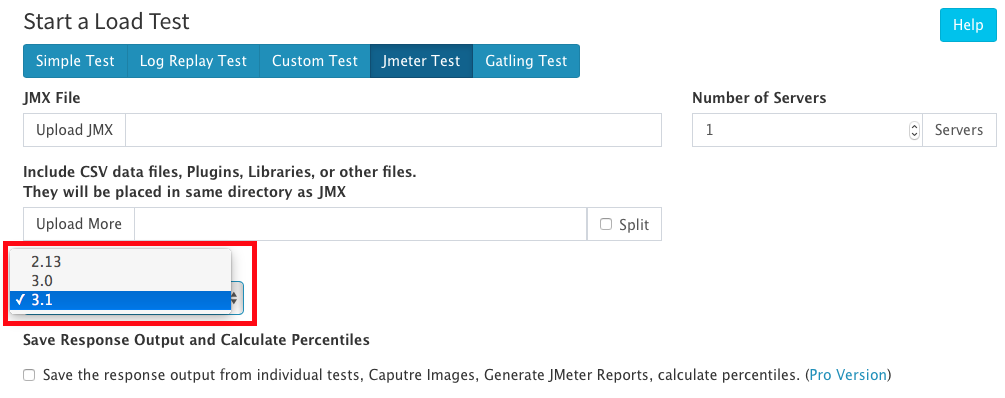
The Apache Software Foundation has recently delivered the newest version of JMeter, version 3.1, and RedLine13 now offers support for this latest release:
What’s New in JMeter 3.1
1.) Updated Reports and Dashboard
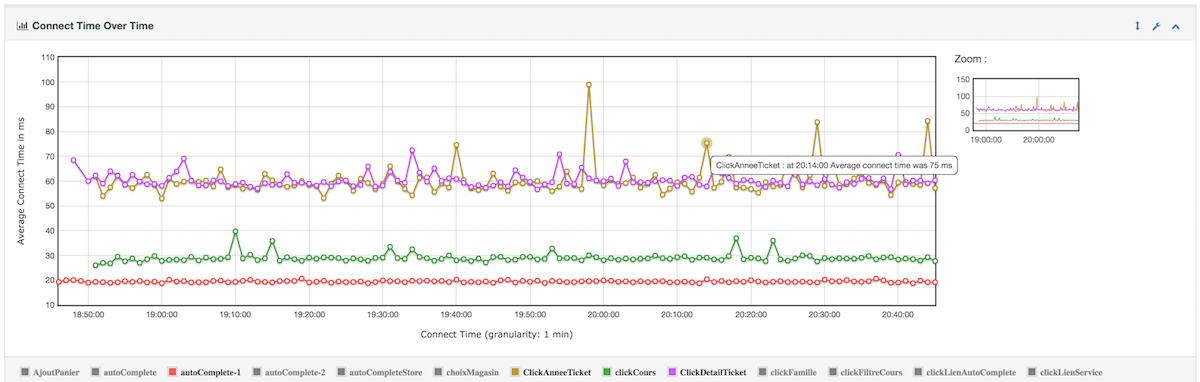
Connect Time Over Time
The new graph, “Connect Time over Time” allows you to see the amount of time it took each request to connect throughout the course of your test. As performance testers, response time is something we pay special attention to and this graph allows us to track those request connections in an easier way, allowing us to address mistakes faster.
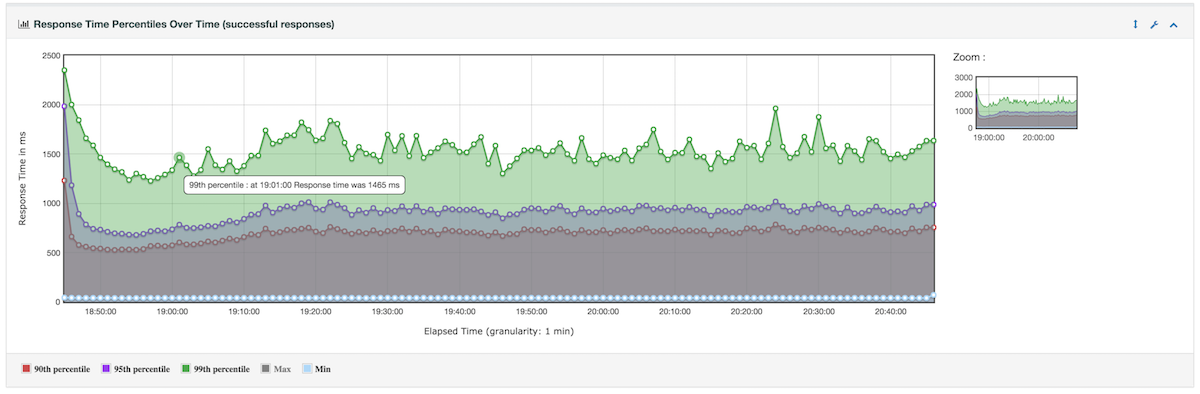
Response Time Percentiles Over Time (Successful Responses)
There is also the “Response Time Percentiles Over Time (Successful Responses)” graph that displays the time it took to processes successful requests over the course of your test for the different percentiles. This graph is a great tool to use to determine how long a user will be waiting for a page to load on your site, for example.
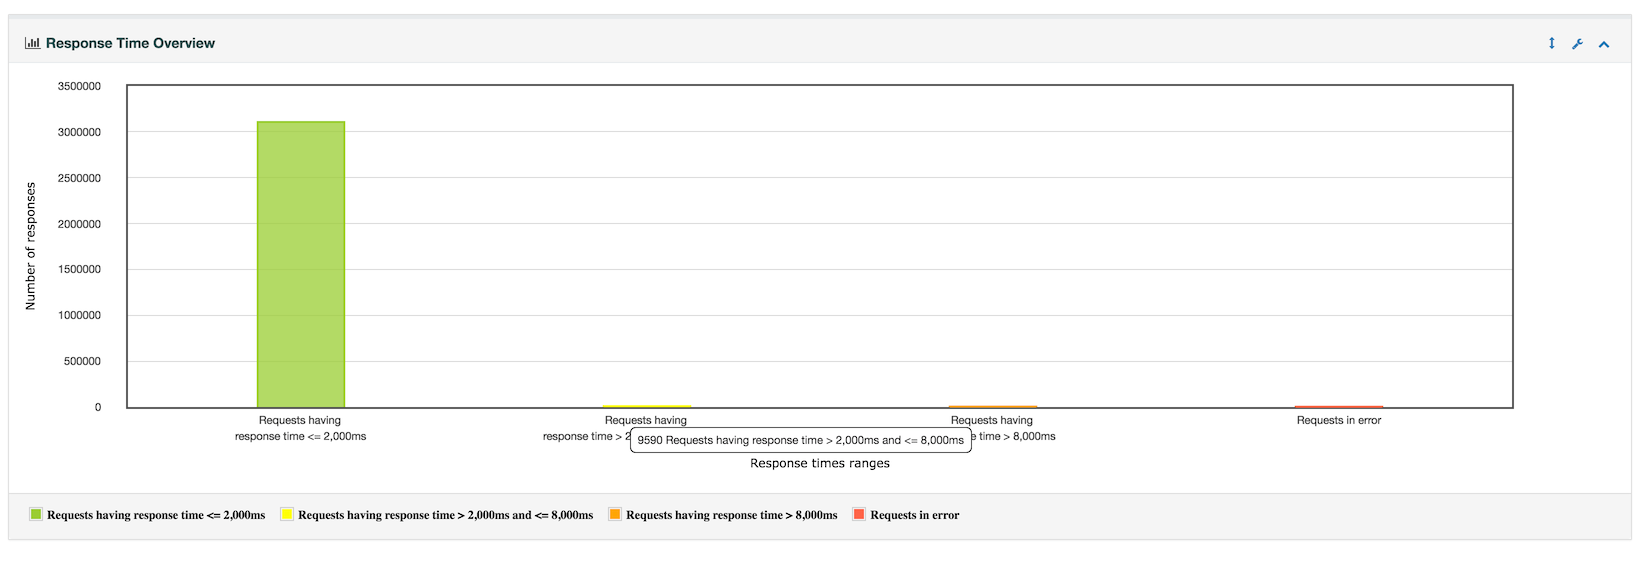
Response Time Overview Graph
Much like the previous graph, the Response Time Overview Graph shows the entire overview for the time it took your system/machine to process all of your requests. You can use this graph, along with the Response Time Percentiles Over Time graph, to compare against your expected results in order to determine the time a user will spend on your site or to identify any bottlenecks.
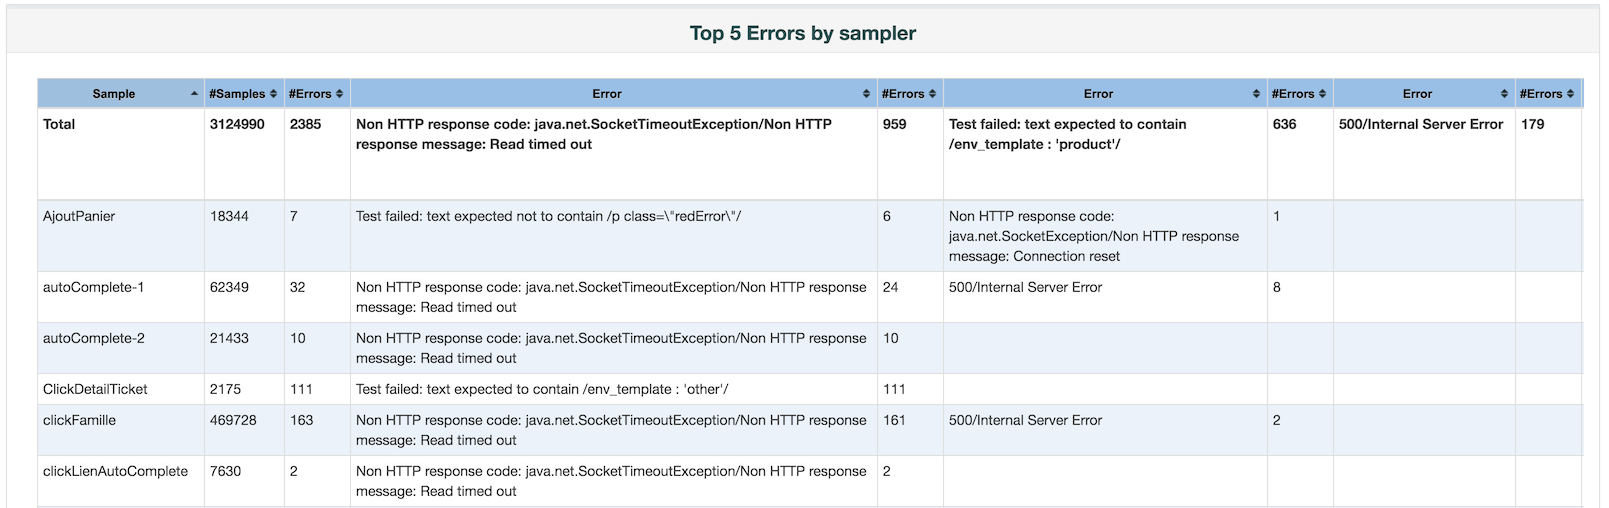
Top 5 Errors by Sampler
JMeter 3.1 also brings forth a new table: “Top 5 Errors by Sampler”. This new table is perfect for identifying your most common errors and any other frequent errors that might cause bottlenecks to occur.
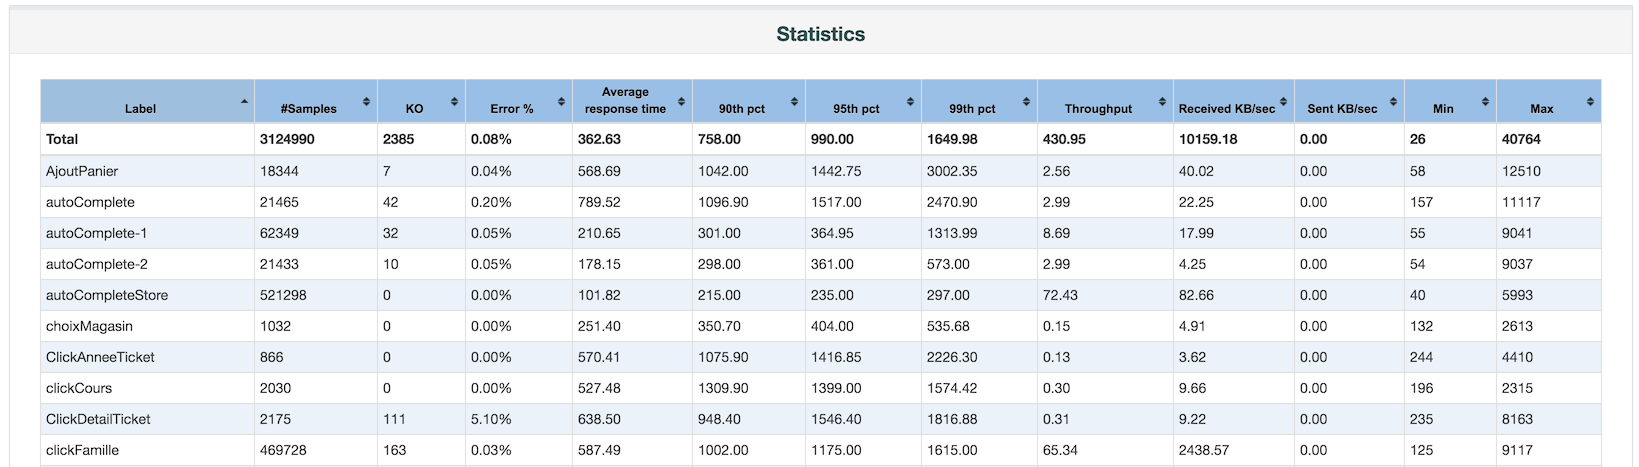
Statistics Table
The Statistics table now shows the average response time.
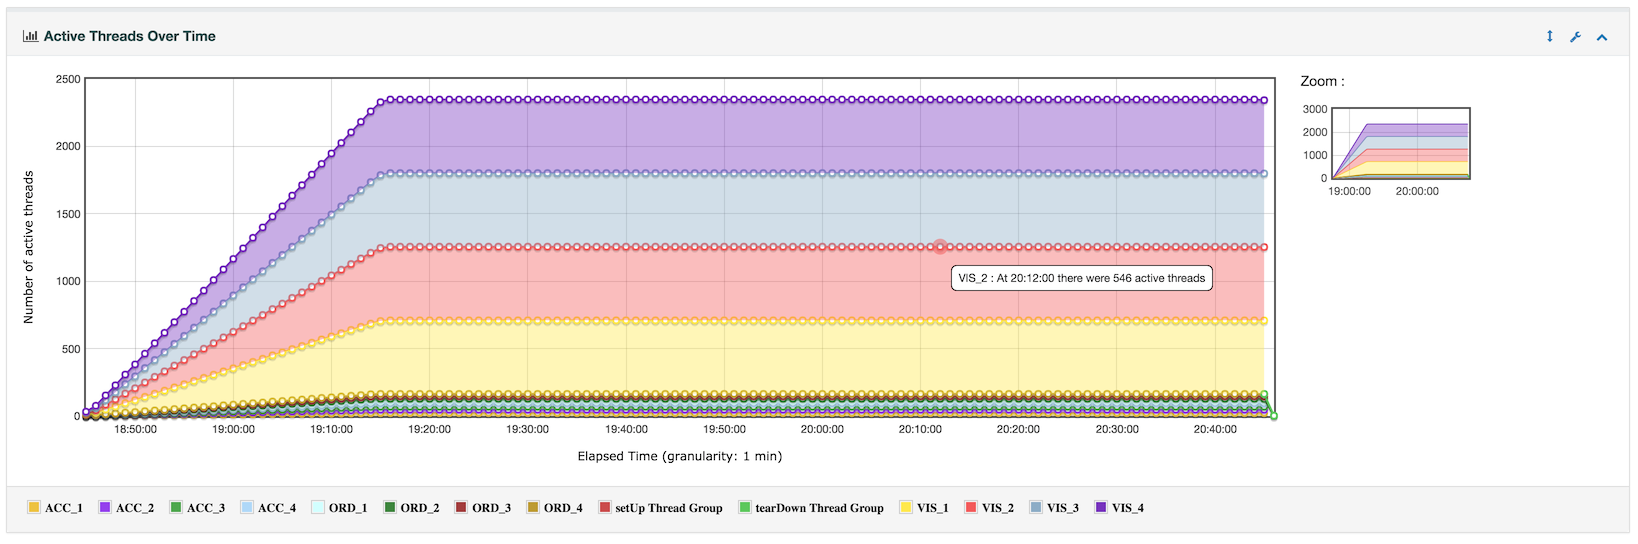
Active Threads Table
The Active Threads table now stacks your threads in a more concise, and easier-to-read fashion.
2.) New Metrics
JMeter 3.1 now supports the “sent_bytes” metric that reports on the bytes sent to a server. Previous generations of JMeter only supported “received_bytes”, so now users have a clearer picture when it comes to analyzing bytes sent to and from servers.
3.) Can Handle Larger Responses
In previous version of JMeter, one common complaint was that it could only handle metric responses around 2GB in size total. JMeter 3.1 is now capable of handling requests up to 9,223,372 TB in size, giving users more freedom.
4.) New _Groovy Function
JavaScript and even BeanShell can cause performance issues in JMeter, and JMeter 3.1 introduces a new _groovy function that enables Groovy functions, something especially useful for test plans that have many concurrent users.
5.) Groovy as Default for JSR-223
When using the JSR-223 sampler, JMeter 3.1 will now default to using Groovy. If you want to use another language, you will have to manually change it.
6.) Formatted HTML Source View in Results Tree View
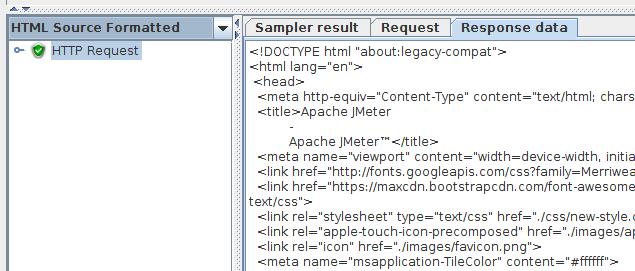
JMeter 3.1 helped to clean up the Results Tree View by removing a lot of white space. Additionally the HTML source code can now be formatted when in source view.
7.) Globally Edit Timers With a New Property
JMeter 3.1 brings a new property (timer.factor=1.0f) that enables you to multiply pause times computed by Gaussian, Uniform, and Poisson Timers by it. This allows you to updated Think Times from one place and let you gain productivity. Timers are a great way for testers to simulate real-world scenarios when crafting their test plans, however they used to be a pain to edit. In previous versions, users would have to manually edit each and every timer. In JMeter 3.1 you can now edit timers globally, saving you time and effort.
These are just the major changes that JMeter 3.1 brings. There are a host of bug fixes, UI/UX fixes, incompatible changes, and other improvements. To see the complete list of changes, head on over to the Apache JMeter website.