RedLine13 continues making load testing easier and cheaper than anyone else. We have extended RedLine13 Gatling support to generate Gatling Reports across all of your load agents. This allows you to take advantage of the RedLine13 generated metrics and full access to the Gatling reports.
You can run your gatling test on 1 – 100 (technically even more) servers and your output will include the cross-agent gatling report. This is supported for Gatling version 2.1.x or Gatling 2.2.x, executed directly or using our maven execution.
Feature requires enterprise plan.
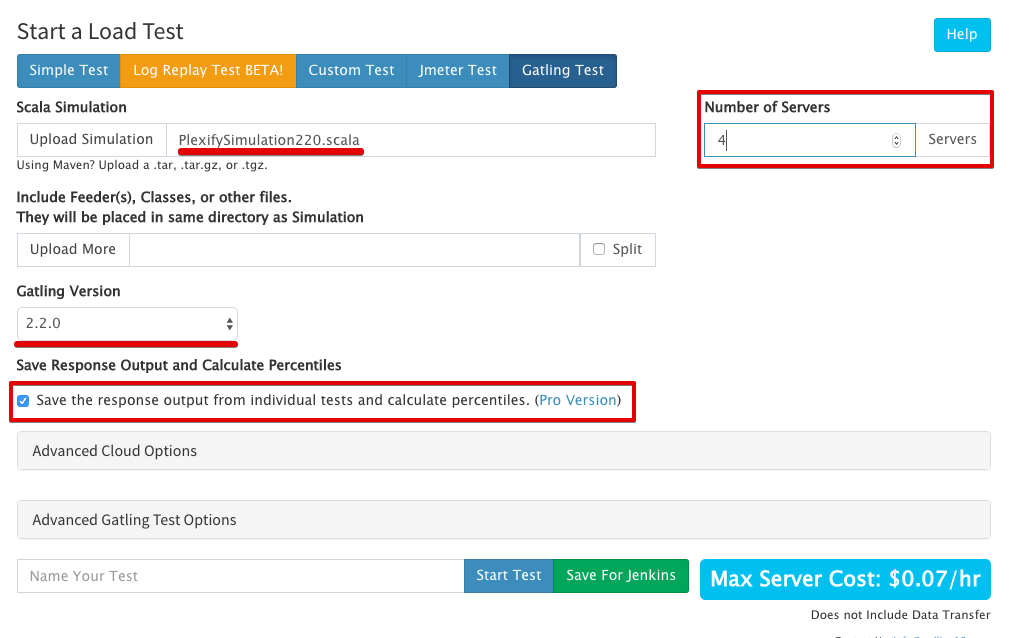
Generating Reports
- Follow the standard steps for running a gatling load test
- Check “Save the response output from individual tests and calculate percentiles”
- Select # servers and your cloud settings.
The following is a 4 server test ( 2 in Virginia, 2 in Mumbai )
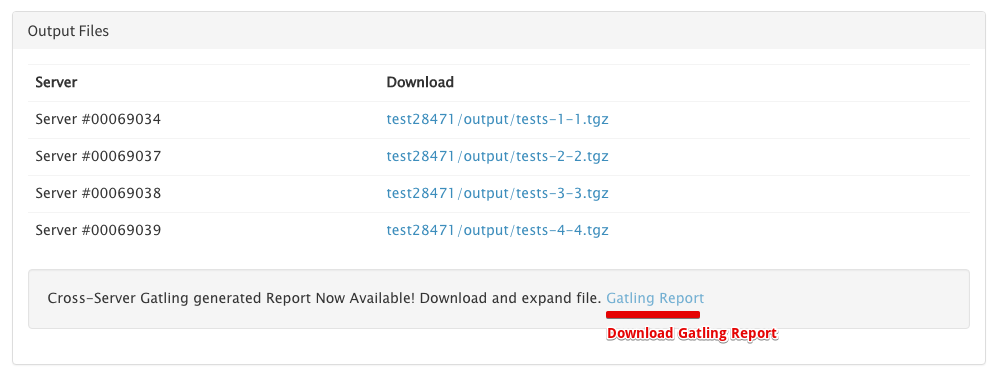
Downloading Gatling Reports
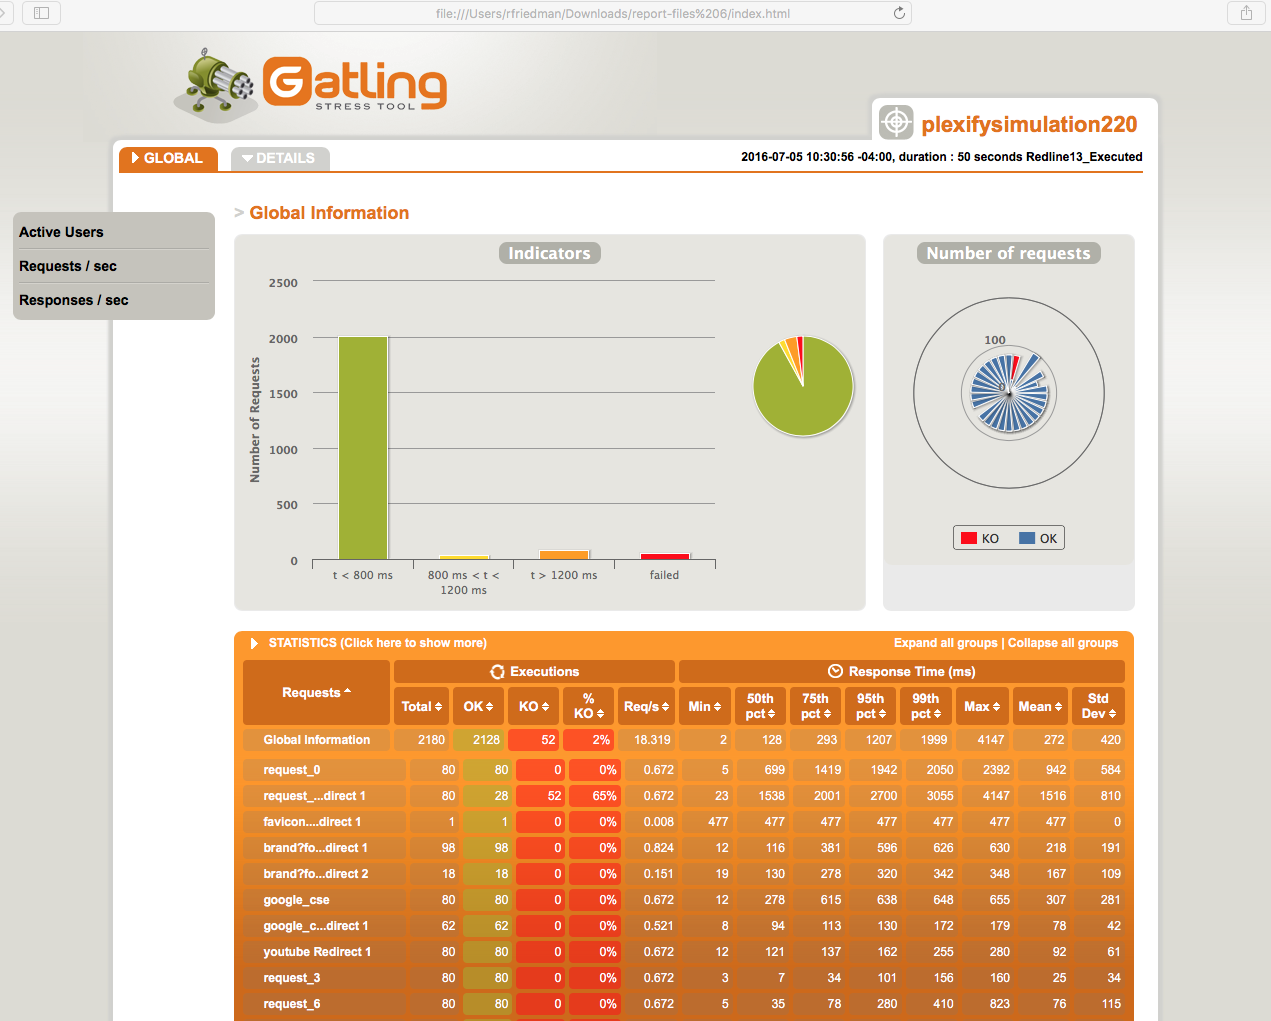
After the test completes and finishes its post-processing the output files will be available. The following report is from the aggregated data across all 4 load agents.
Viewing Gatling Report
Once downloaded and expanded just open the index.html in your browser and you will have full access to the Gatling-Reports.
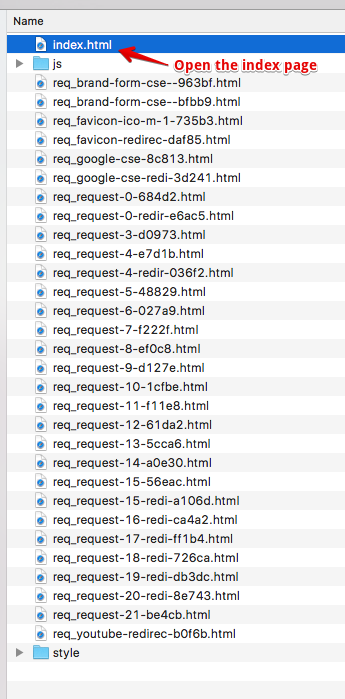
And you have the full gatling report.
RedLine13 Reports
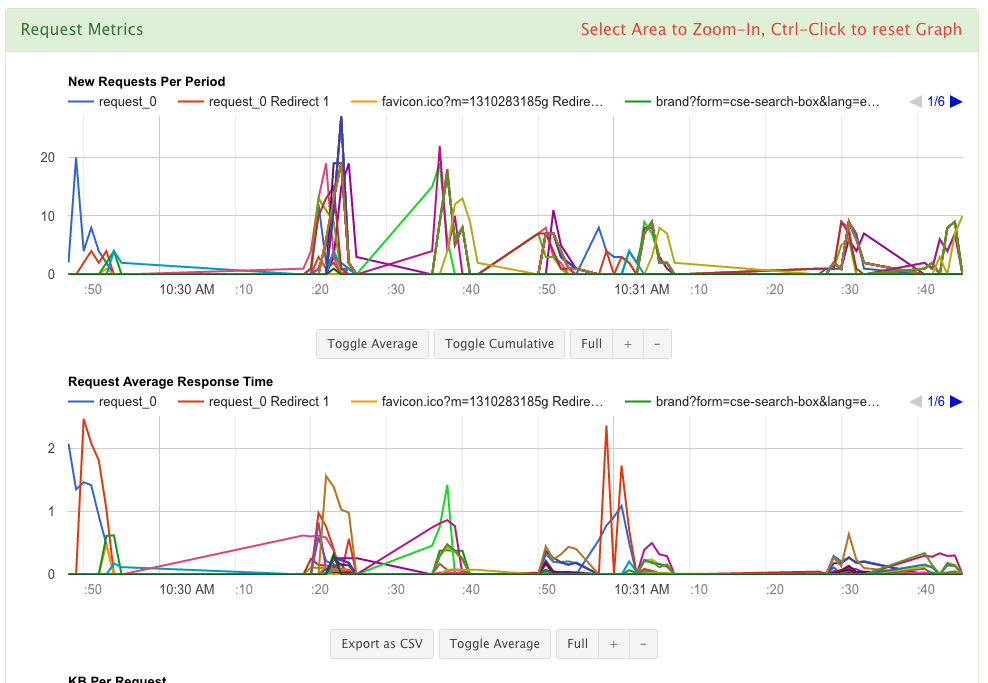
RedLine13 metrics and reports are available for viewing in the web ui. RedLine13 UI metrics are displayed live during the test and summarized after the test completes. RedLine13 metrics include dashboard, percentiles, overview, error, agent, and error logs.
Summary
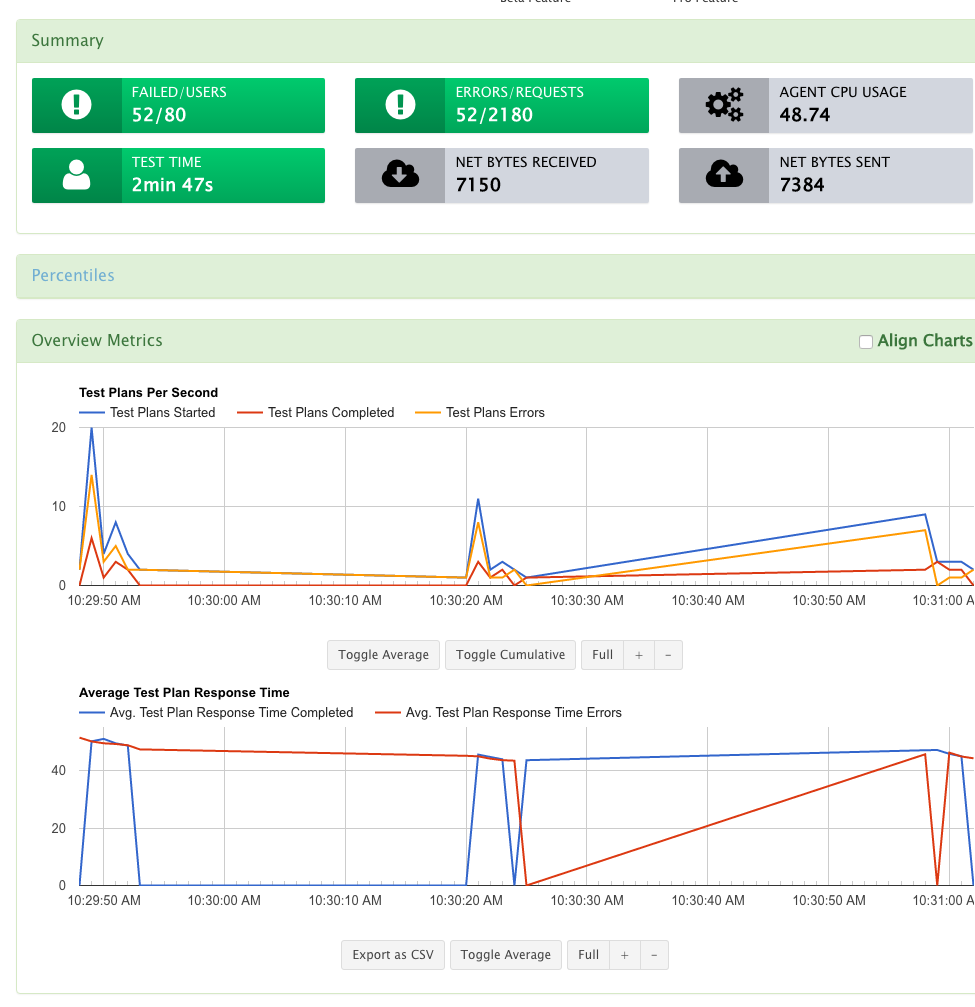
Metrics
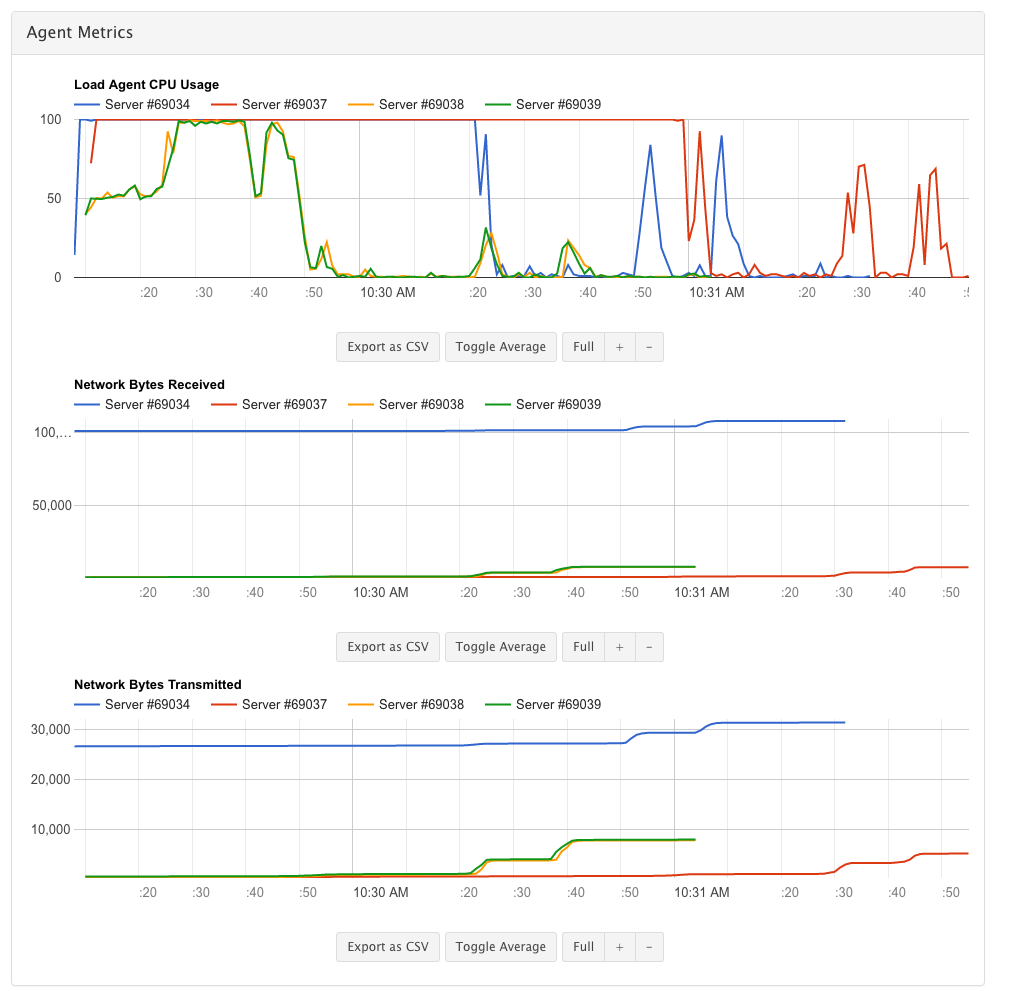
Agent Metrics
- Two servers are m3.medium and two are m4.large. You can see the difference in the CPUs between them.