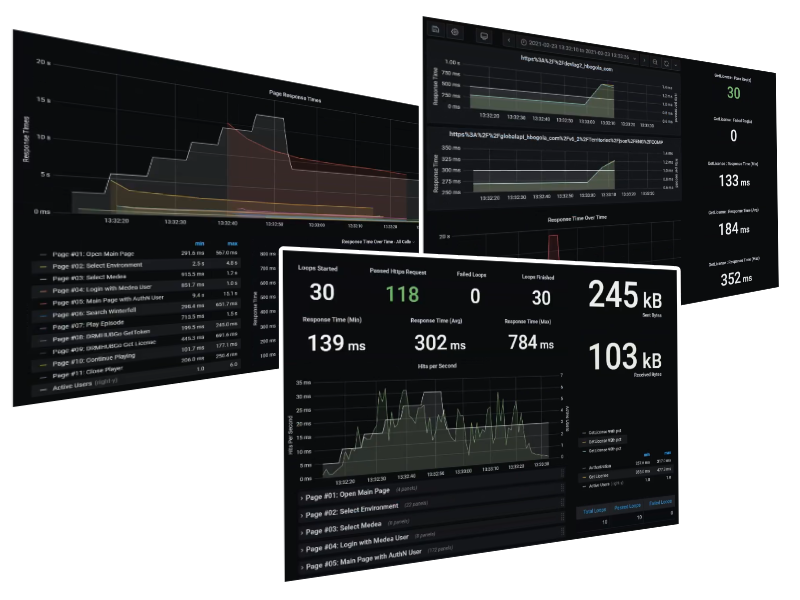
Using Grafana to visualize your test metrics
2021-03-16
Making sense of load test performance metrics and displaying in a manner necessary to drive business decisions can be a challenging endeavor. This data usually comes from multiple different sources, and collecting it can be cumbersome. One way to lessen this burden is to automate the collection of these performance metrics into a unified analysis platform. This is precisely how one customer has leveraged simple plugins and a popular time series database to effortlessly display theirRead More →