In a previous post we discussed how ChatGPT could be used to assist and partially automate JMeter test plan creation. In this post, we will explore how ChatGPT can be used to help analyze and compare JMeter load test results. I’d like to take a more illustrative approach showing the types of tasks that ChatGPT is good at solving. This will give you a better idea of how to structure queries and get the most out of your interactions with the service.

Experimenting with ChatGPT Prompts
The best way to get started is by asking ChatGPT what it can do. The technical term for this is with prompts. There is an entire area of study dedicated to prompt engineering which coaxes the generative model to use in-context cues to perform a desired task. Interactive models such as ChatGPT also consider the conversational history, and therefore We can start by providing a leading prompt in the form of a general question:
ChatGPT responds with its characteristic enthusiasm asking for results data. In its current form, external data can best be imported into the chat by copying and pasting file contents. For JMeter tests, this exists in the form of JTL files containing comprehensive test results. Here we will respond with the data and a prompt asking for general analysis:
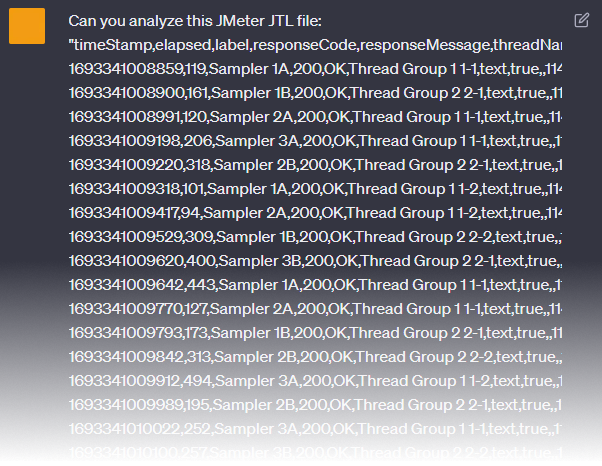
For this generic request, unsurprisingly we get a generic response from ChatGPT, providing us with an explanation of the JTL file structure and some generic assertions about the contents. In other words, it does not perform a useful analysis. For that we must be more specific – and things get a little more exciting when we do ask for some specific analyses.
Getting Specific with Prompts
Let’s experiment with the following prompt as a follow up question within the same chat thread:

ChatGPT gives us a response that is far more useful. It suggests that we use a Python script to produce the graph we have asked for, however it takes the initiative to write that script:
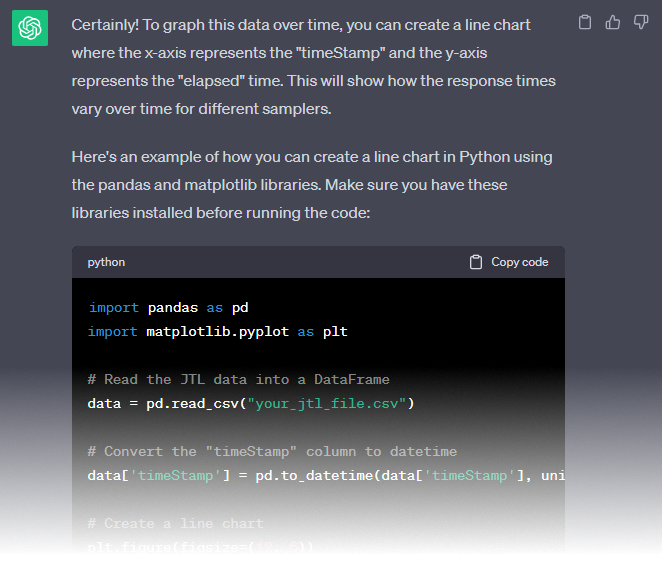
The full script it has provided is as follows:
import pandas as pd
import matplotlib.pyplot as plt

# Read the JTL data into a DataFrame
data = pd.read_csv("your_jtl_file.csv")

# Convert the "timeStamp" column to datetime
data['timeStamp'] = pd.to_datetime(data['timeStamp'], unit='ms')

# Create a line chart
plt.figure(figsize=(12, 6))
for label, group in data.groupby('label'):
 plt.plot(group['timeStamp'], group['elapsed'], label=label)

# Set labels and title
plt.xlabel('Time')
plt.ylabel('Elapsed Time (ms)')
plt.title('Response Time Over Time')

# Show a legend
plt.legend()

# Rotate x-axis labels for better readability
plt.xticks(rotation=45)

# Display the chart
plt.tight_layout()
plt.show()
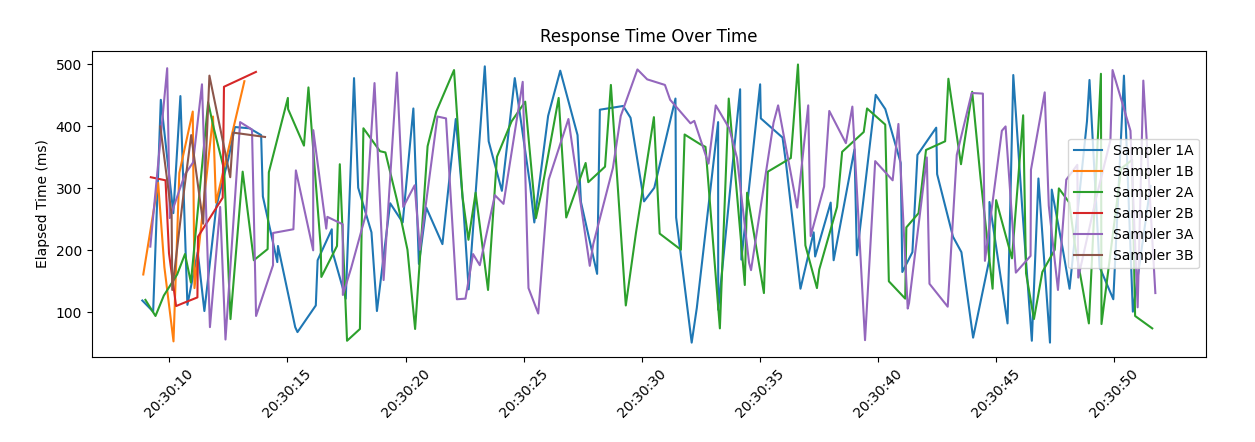
It tells us to replace your_jtl_file.csv with our results file. Since JTL files also follow the CSV format, we can simply replace this with the path to our JTL results. Simply copying and pasting the above code into your favorite Python editor yields the following graph when the script is run:
Let’s now follow up with a related request, this time to graph threads over time:

ChatGPT responds with a similar Python script, when executed against our JTL results file yields the following graph:
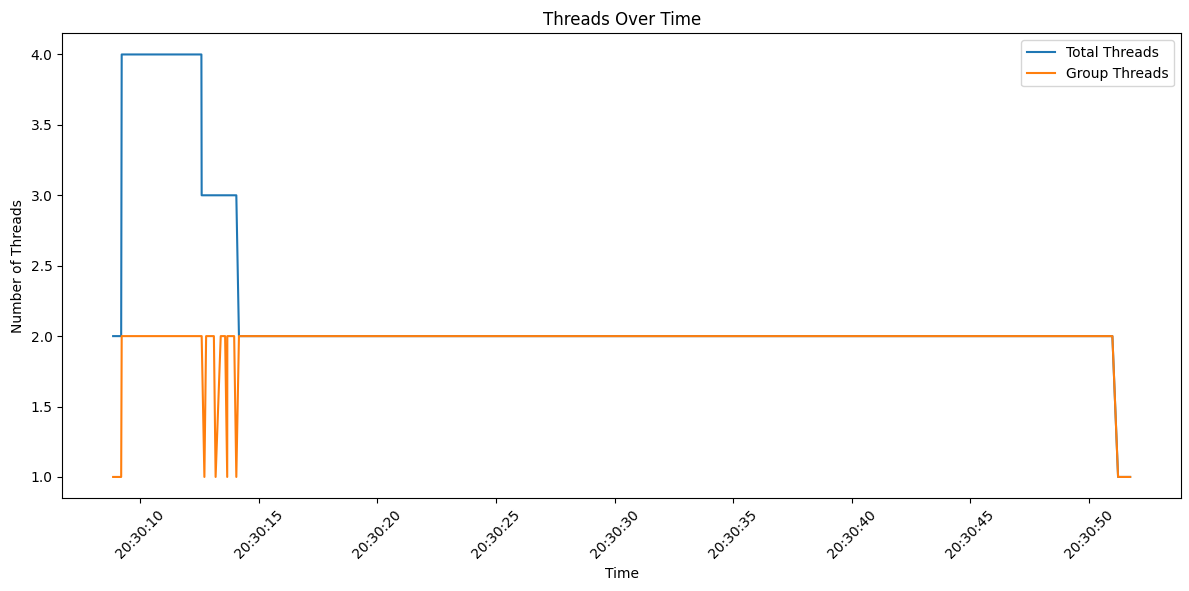
From these examples you can see that ChatGPT is using Matplotlib to generate graphed output, which in conjunction with Python is one of the more common ways the service favors generating code and scripting. If your particular use case necessitates a different language or tool, ChatGPT surprisingly excels at writing code in a multitude of languages.
Comparing Two or More Load Tests
Now that we have demonstrated how to generate graphs based on the results of a single load test, let’s ask ChatGPT to do something more advanced. In a previous post we detailed how to use the JMeter Merge Results plugin to perform a comparison between two different load tests. There is a relatively common need to compare two or more iterations of a load test, though there are limited tools available for doing so. Let’s see if ChatGPT can simplify this task and produce a Python script based on the following prompt:

After about two seconds of think-time, ChatGPT writes us a Python script that is up to the task:
import pandas as pd
import matplotlib.pyplot as plt

# Load the data from the first JTL file
jtl_file1 = "test1.jtl"
data1 = pd.read_csv(jtl_file1)

# Load the data from the second JTL file
jtl_file2 = "test2.jtl"
data2 = pd.read_csv(jtl_file2)

# Convert the "timeStamp" column to datetime
data1['timeStamp'] = pd.to_datetime(data1['timeStamp'], unit='ms')
data2['timeStamp'] = pd.to_datetime(data2['timeStamp'], unit='ms')

# Create line charts for response times
plt.figure(figsize=(12, 6))

# Plot response times from the first test
plt.plot(data1['timeStamp'], data1['elapsed'], label='Test 1 Response Time', linestyle='-', color='blue')

# Plot response times from the second test
plt.plot(data2['timeStamp'], data2['elapsed'], label='Test 2 Response Time', linestyle='-', color='red')

# Set labels and title
plt.xlabel('Time')
plt.ylabel('Response Time (ms)')
plt.title('Response Times Comparison Over Time')

# Show a legend
plt.legend()

# Rotate x-axis labels for better readability
plt.xticks(rotation=45)

# Display the chart
plt.tight_layout()
plt.show()
This time, it has conveniently labeled and commented where we should enter the filenames for our two separate JTL files in the code. Running the script in Python produces the following graphs without any further modification necessary:
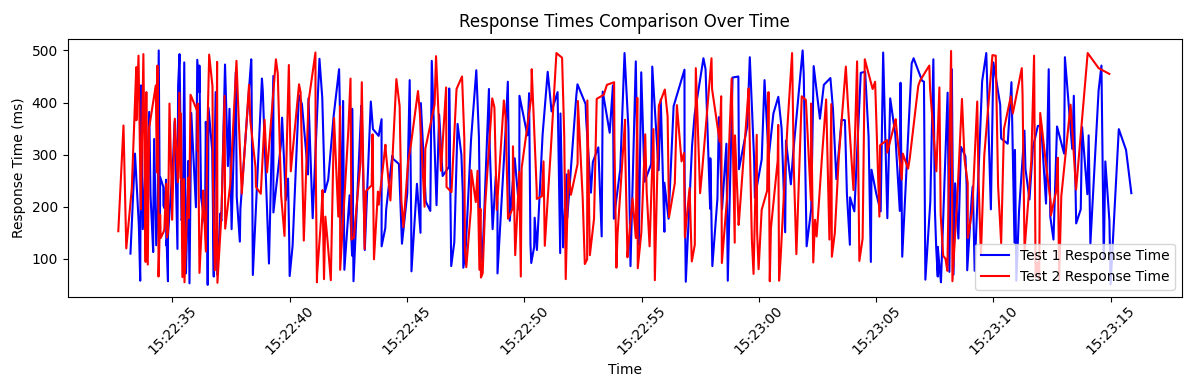
This is of course only one example of the type of analysis that ChatGPT can be prompted to produce for comparing two load tests. Conceivably we could also ask for a similar script that would compare more than two tests as larger series comparison. We could also ask it to generate different types of graphs including bar graphs, pie charts, or any of the other visualization styles available in Matplotlib.
Conclusion
Traditional methods of performing custom analysis on JMeter test results typically are divided into two categories. One is to use third party tools that are purpose-built for specific task analysis. This includes the Merge Results plugin we discussed in a previous post, or other tools such as Grafana, InfluxDB, and DynaTrace. In the event that specialized analysis of the data is required, the other method is to digest the raw JTL or CSV results using a spreadsheet application or database. ChatGPT adds a third alternative to these methods, with the benefit of using automation to assist in repetitive and overly technical tasks.
Did you know that RedLine13 offers a full-featured, time-limited free trial? Sign up now, and start testing today!